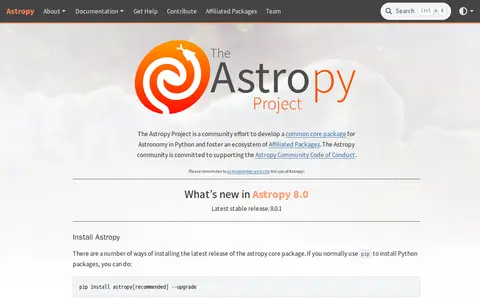
Astropy is a community effort to develop a common core package for astronomy in Python and foster an ecosystem of Affiliated Packages. Installation is available via pip and other package managers, and the project provides tutorials, documentation, and community help channels.
Directory
Search results
Published directory entries matching your search.
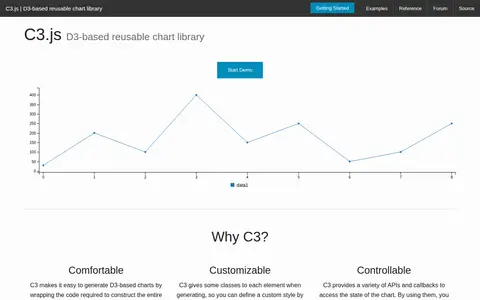
C3.js is a D3-based reusable chart library. It wraps the code required to construct entire charts, gives classes to elements for custom styling, and provides APIs and callbacks to access chart state and update charts after rendering.
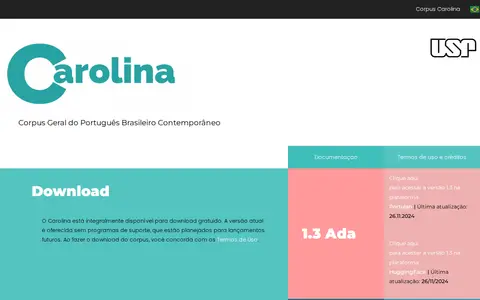
General Corpus of Contemporary Brazilian Portuguese with provenance and typology information - Corpus Geral do Português Brasileiro Contemporâneo.
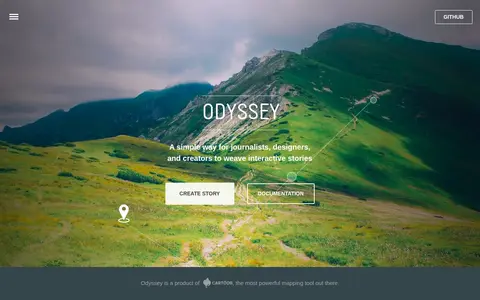
Odyssey.js is an open source tool that combines maps, narratives and other multimedia into stories. It offers templates including scrolling, slide based and temporal designs, and Actions for map movements and content display. The sandbox lets users test the library and edit story content with Markdown. It is an early-stage project developed by cartodb.com with Knight Foundation funding.
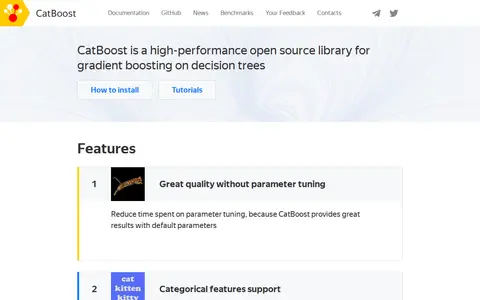
CatBoost is an open-source gradient boosting library on decision trees, developed by Yandex as the successor to its MatrixNet algorithm. It natively supports categorical features without preprocessing, offers a fast GPU implementation for large datasets, and reduces overfitting via a proprietary gradient boosting scheme. The library is used for tasks including search, recommendation systems, and weather prediction at Yandex.
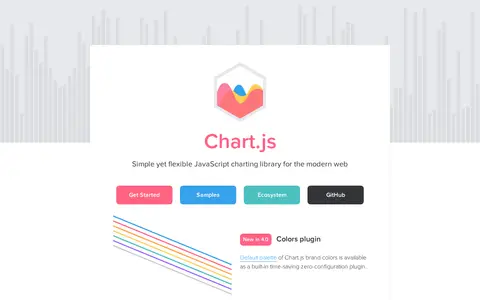
Chart.js is an open source JavaScript charting library for the modern web, described as simple yet flexible. It supports eight animated and customisable chart types and renders on HTML5 Canvas across modern browsers, redrawing charts on window resize. Version 4.0 added a colors plugin and tree-shaking to reduce bundle size.
cheminfo.org is a website offering a collection of utilities for chemistry and related fields. Tools include NMR spectrum analysis, mass spectrometry, JSON conversion, and image processing. The site also provides exercises and simulators for spectral interpretation.
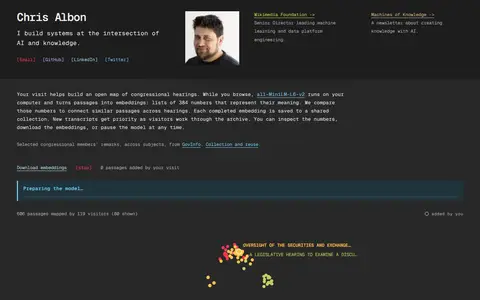
A personal website of Chris Albon. While browsing, the all-MiniLM-L6-v2 model runs on the visitor's computer and turns passages from congressional hearings into 384-number embeddings, which are compared to connect similar passages. Completed embeddings are saved to a shared collection, and visitors can inspect the numbers, download embeddings or pause the model.
Specialized AI Analysis of Congressional Stock Trades. Track the real-time stock trades of every member of Congress, aggregated into a single.
ConvertCSV.com is a collection of online tools for converting CSV and Excel data to and from formats such as JSON, XML, SQL, YAML, KML, GeoJSON, HTML, Markdown and PDF. It also provides a CSV viewer and editor, a CSV validator, SQL querying and data extraction tools. The tools run on the client side, so data never leaves the computer.
Mapa do crime no Brasil com dados oficiais de polícia, DataSUS e CNJ. Busque sua cidade ou bairro e veja estatísticas por 100 mil habitantes.
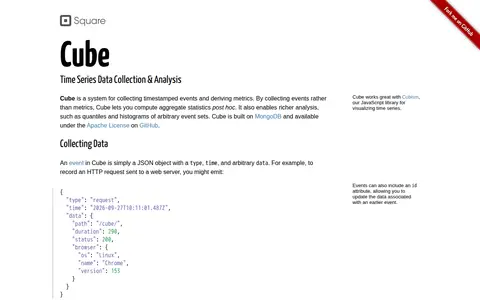
Cube is a system for collecting timestamped events and deriving metrics, built on MongoDB and released under the Apache License on GitHub. It accepts events via UDP, HTTP POST, and WebSockets, defines a query language for retrieving events, and groups events by time to compute aggregate metrics.
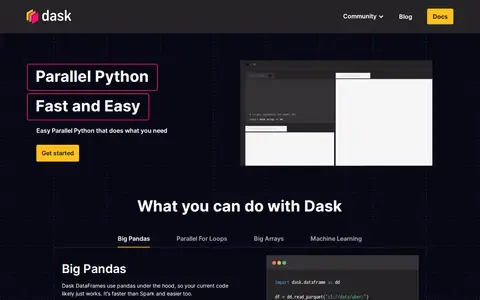
Dask is an open-source Python library for parallel computing maintained by contributors across dozens of companies. The site describes uses including Dask DataFrames for pandas, parallel for loops, large arrays with NumPy and Xarray, and machine learning. It can run on a laptop or be deployed on resource managers such as Kubernetes or cloud.
Dataconomy is a news site covering technology and business topics. Its homepage lists recent articles on subjects including TikTok advertising, PS5 emulation, Character.AI staffing, DeepSeek API pricing, NVIDIA hardware, Tesla vehicles, Google Gmail features and Netflix layoffs. Other pages carry articles on the Opera Air browser and comparisons of crypto loan platforms.
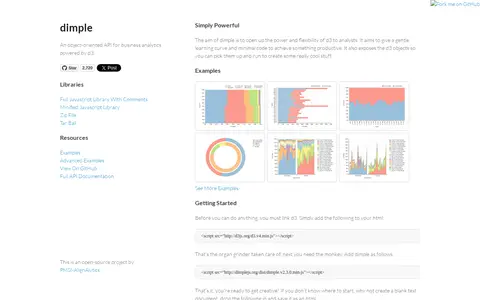
Dimple is an open-source charting API for d3 aimed at business analytics, letting users create and combine bar, line, area and scatter charts. It exposes underlying d3 objects so analysts can build on them, and requires linking d3 before adding dimple to a page.
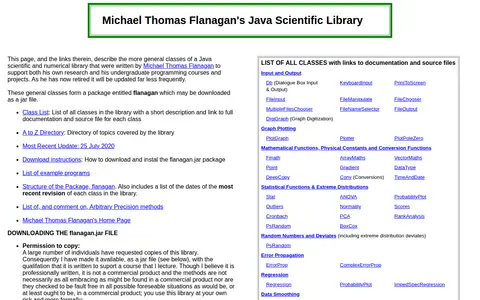
A Java scientific and numerical library written by Michael Thomas Flanagan to support his research and undergraduate programming courses. It is distributed as the flanagan.jar package and includes general classes, example programs and arbitrary precision methods. The author has retired and states it will be updated less frequently. Commercial use, public listing of source codes and redistribution are not permitted.
Efficient pure-Matlab implementations of graph algorithms to complement MatlabBGL's mex functions.
Generative AI Database is a Notion-based collaborative AI workspace built to align with an organization's existing context. It enables users to build and orchestrate AI agents directly alongside team projects, meetings, and connected applications.
Right now, ChatGPT, Perplexity, Claude, and Gemini are answering questions about your industry. They.
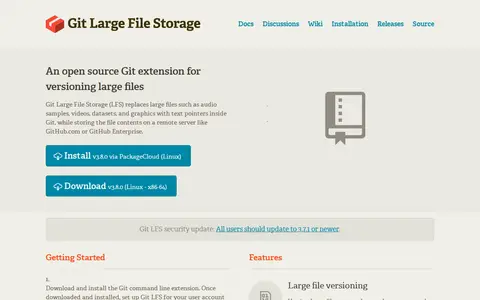
Git Large File Storage (Git LFS) is an open source Git extension for versioning large files. It replaces large files such as audio samples, videos, datasets, and graphics with text pointers inside Git while storing the file contents on a remote server like GitHub.com or GitHub Enterprise. Installation is available for Windows, Mac, and Linux. Tracking file types does not convert pre-existing files, which requires the git lfs migrate command.
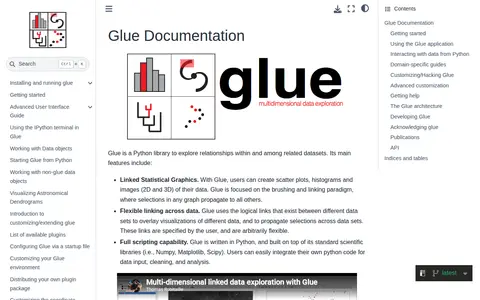
Glue is a Python library for exploring relationships within and among related datasets. It provides linked statistical graphics such as scatter plots, histograms and 2D and 3D images, with selections in one graph propagating to others. It supports user-specified links across datasets and scripting through Python's scientific libraries.
Multi-platform open source analytics and interactive visualization web application.
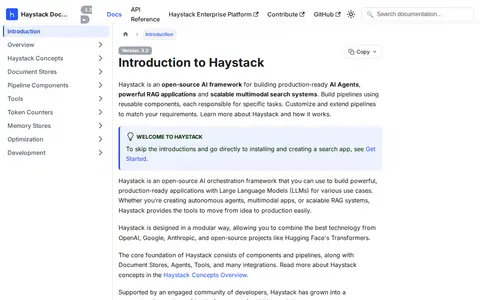
Modular pipelines for retrieval and generative AI applications.
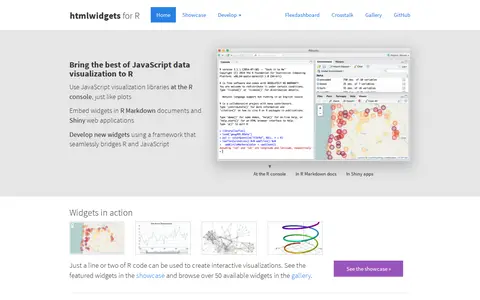
HTML widgets are R packages that produce interactive web visualizations, working like R plots. A line or two of R code produces a D3 graphic or Leaflet map. Widgets run at the R console and can be embedded in R Markdown reports and Shiny web applications. The page lists widget examples including Leaflet, dygraphs, Plotly and Highcharter, and describes composing dashboards with flexdashboard and linking widgets with crosstalk. New widgets can be developed by bridging R and JavaScript.