


Loic Tetrel is a blog about computer science and data science topics. Posts cover subjects such as enabling GPU acceleration in Windows 11 Hyper-V virtual machines, using Android TV without a Google account, and Windows/Linux dual-boot.
CatBoost
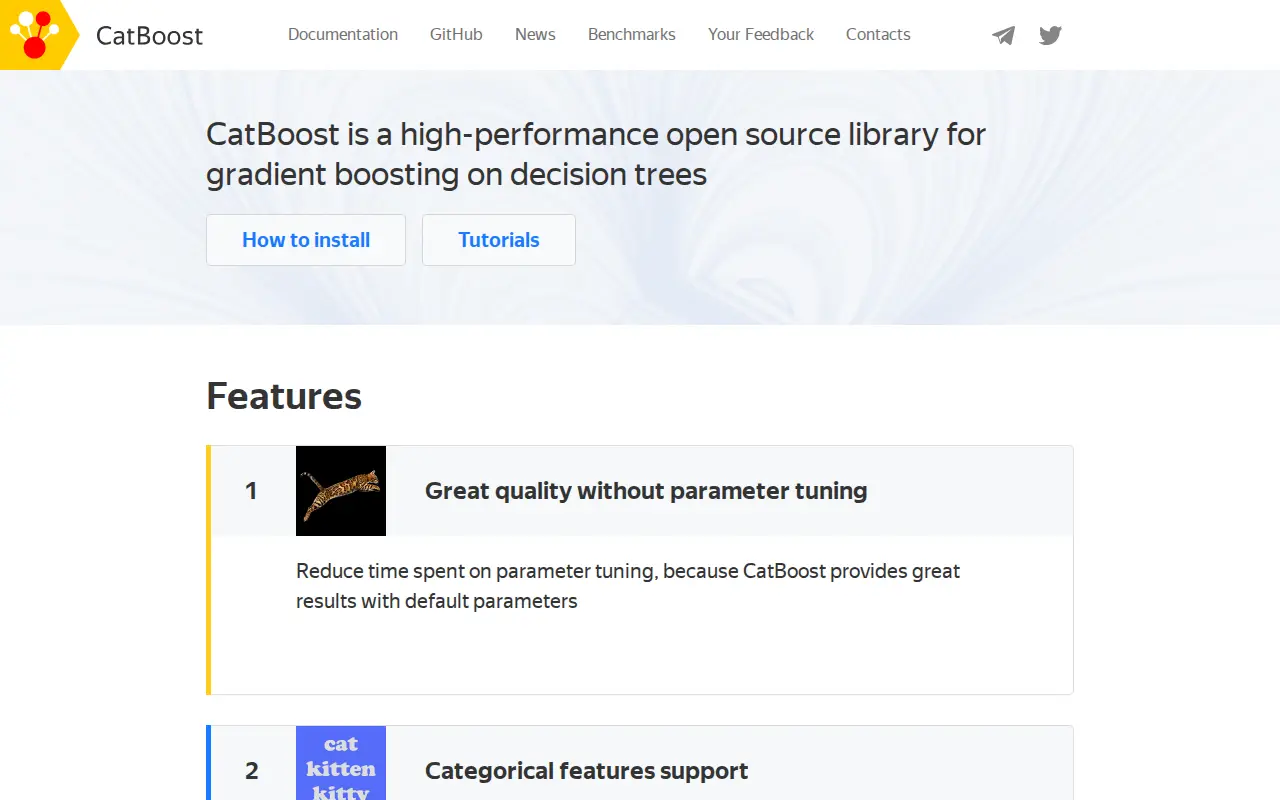
CatBoost is an open-source gradient boosting library on decision trees, developed by Yandex as the successor to its MatrixNet algorithm. It natively supports categorical features without preprocessing, offers a fast GPU implementation for large datasets, and reduces overfitting via a proprietary gradient boosting scheme. The library is used for tasks including search, recommendation systems, and weather prediction at Yandex.
Links
Tags
-
0Loic Tetrel is a blog about computer science and data science topics. Posts cover subjects such as enabling GPU acceleration in Windows 11 Hyper-V virtual machines, using Android TV without a Google account, and Windows/Linux dual-boot.
-
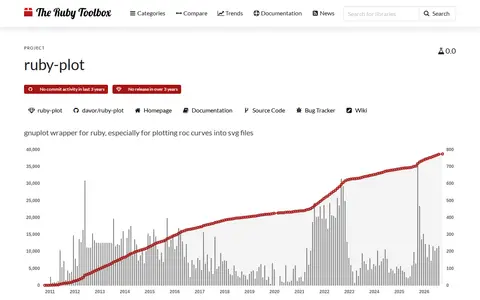
0ruby-plot is a Ruby wrapper around gnuplot, especially for plotting ROC curves into SVG files. It requires gnuplot to be installed and has had no release in over three years.
-
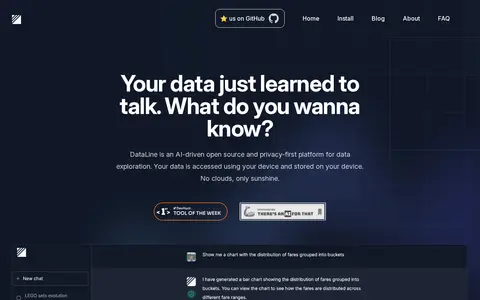
0DataLine is an AI data analysis and visualization tool that lets users chat with their data to generate tables, charts, and dashboards. The page describes it as suited to non-technical people querying data and to developers seeking a text2sql solution.
-
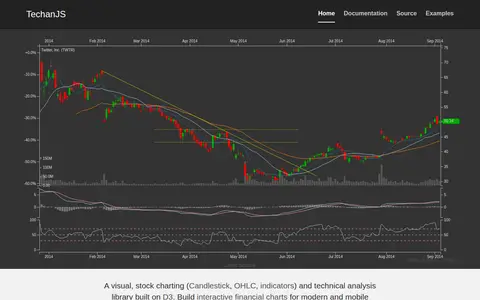
0TechanJS is a library built on D3 for financial charting and technical analysis. It provides visual stock charting, including candlestick, OHLC and indicators, for building interactive financial charts for modern and mobile browsers.
-
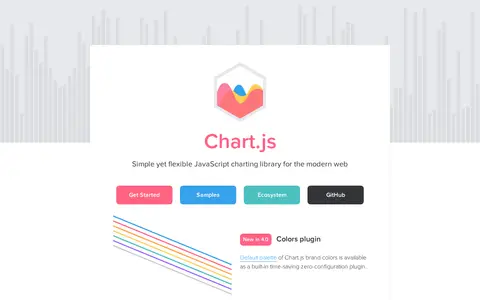
0Chart.js is an open source JavaScript charting library for the modern web, described as simple yet flexible. It supports eight animated and customisable chart types and renders on HTML5 Canvas across modern browsers, redrawing charts on window resize. Version 4.0 added a colors plugin and tree-shaking to reduce bundle size.
-
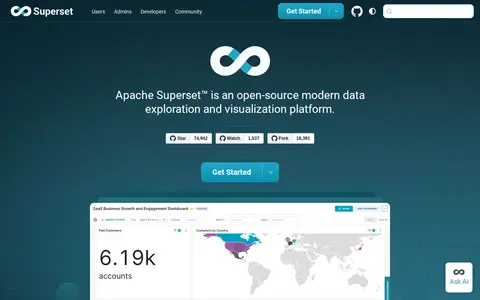
0Apache Superset is an open-source data exploration and visualization platform. It offers a no-code visualization builder and a SQL IDE, connects to SQL-based databases, and ships with more than 40 pre-installed visualization types. It includes dashboards, a chart builder, SQL Lab and datasets, with a plug-in architecture for custom visualizations.
Community notes
Reviews and discussion
No reviews yet
Be the first to share how this project worked for you.
Join the discussion
Sign in with a verified account to leave a review or join the discussion.
Sign in to review