

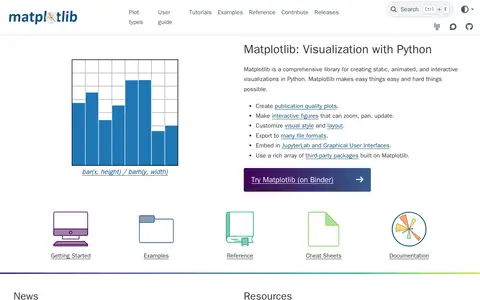
Matplotlib is a comprehensive Python library for creating static, animated, and interactive visualizations. It supports publication quality plots, interactive figures that zoom, pan and update, customizable visual styles and layouts, and exporting to many file formats. It can be embedded in JupyterLab and graphical user interfaces, and third-party packages extend and build on its functionality.
htmlwidgets
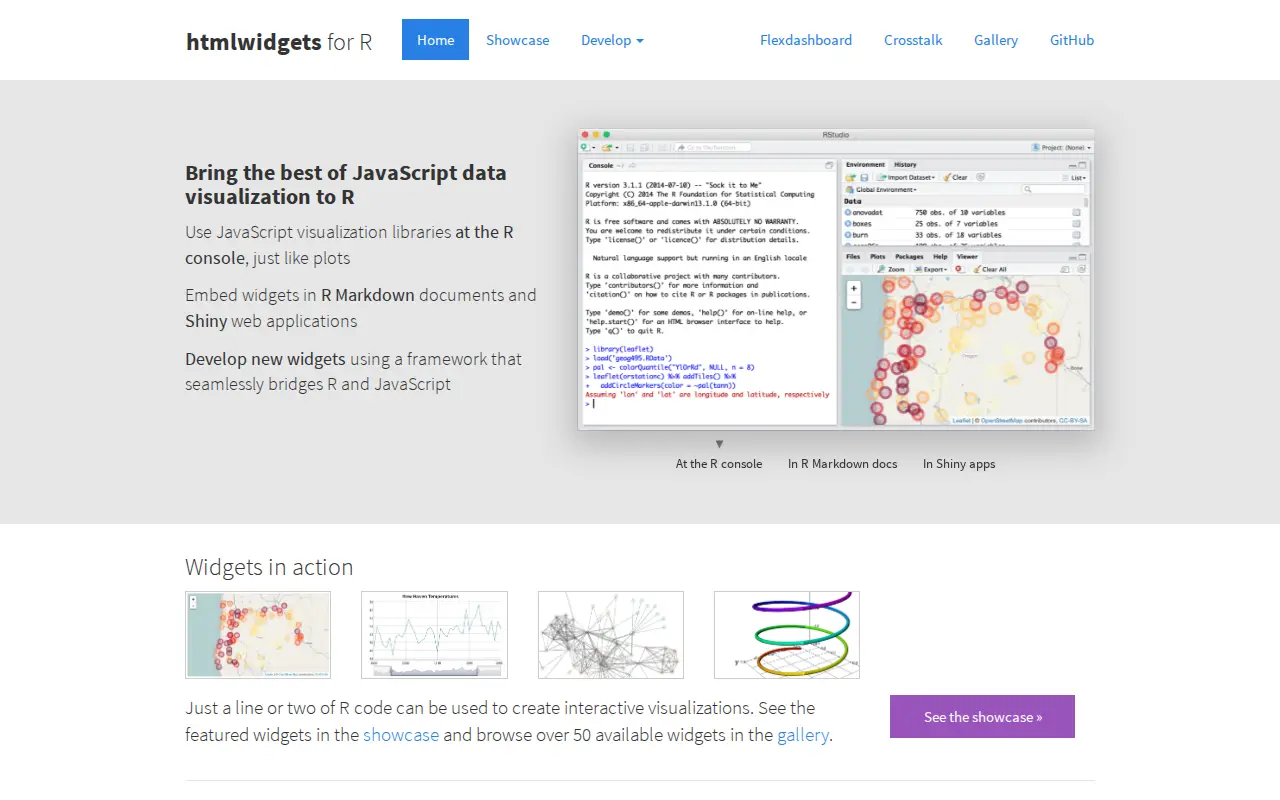
HTML widgets are R packages that produce interactive web visualizations, working like R plots. A line or two of R code produces a D3 graphic or Leaflet map. Widgets run at the R console and can be embedded in R Markdown reports and Shiny web applications. The page lists widget examples including Leaflet, dygraphs, Plotly and Highcharter, and describes composing dashboards with flexdashboard and linking widgets with crosstalk. New widgets can be developed by bridging R and JavaScript.
Features
- HTML widgets work just like R plots except they produce interactive web visualizations Source: www.htmlwidgets.org
Uses
- Embed widgets in R Markdown documents and Shiny web applications Source: www.htmlwidgets.org
Links
Tags
-
0Matplotlib is a comprehensive Python library for creating static, animated, and interactive visualizations. It supports publication quality plots, interactive figures that zoom, pan and update, customizable visual styles and layouts, and exporting to many file formats. It can be embedded in JupyterLab and graphical user interfaces, and third-party packages extend and build on its functionality.
-
0NCEI is a NOAA center that provides environmental data on historical weather, climate, ocean and magnetic field conditions. It maintains an archive of oceanic, atmospheric and geophysical data, archiving over 229 terabytes each month from over 130 observing platforms. NCEI is moving its data and applications to the cloud, which may cause temporary data access delays.
-
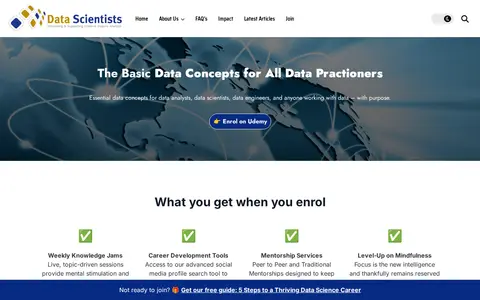
0A membership program with a Udemy course on basic data concepts, weekly knowledge jams, career development tools and mentorship services. A limited-time membership is offered at $50 USD per year, cancellable anytime, and participants can join a LinkedIn community.
-
0, a pluggable architecture for data and image processing, which can.
-
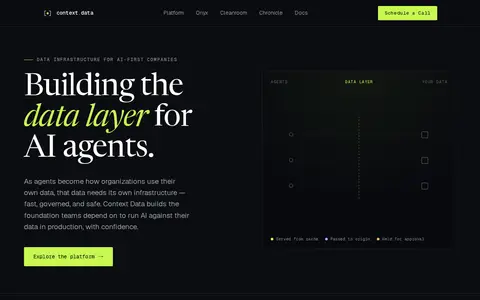
0InterLock is a proxy positioned between AI agents and databases, files and APIs. It authorizes each request by role and policy, redacts sensitive fields before the agent sees them, holds risky writes for approval and audits requests. It deploys as infrastructure inside the user's environment, and the agents and data stores do not change.
-
0Harvard Data Science applies AI to data analysis, extraction, visualization, or business intelligence.
Community notes
Reviews and discussion
No reviews yet
Be the first to share how this project worked for you.
Join the discussion
Sign in with a verified account to leave a review or join the discussion.
Sign in to review