


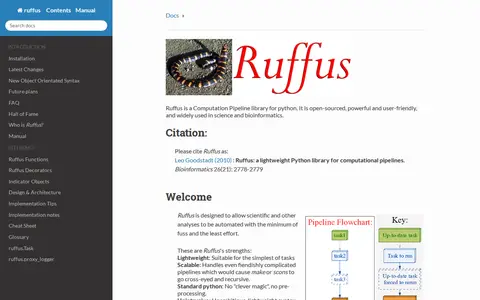
Ruffus is an open-source computation pipeline library for Python, used in science and bioinformatics. It is designed to automate scientific and other analyses with a lightweight, standard-Python syntax, and can be installed from the Python Package Index.
Glue
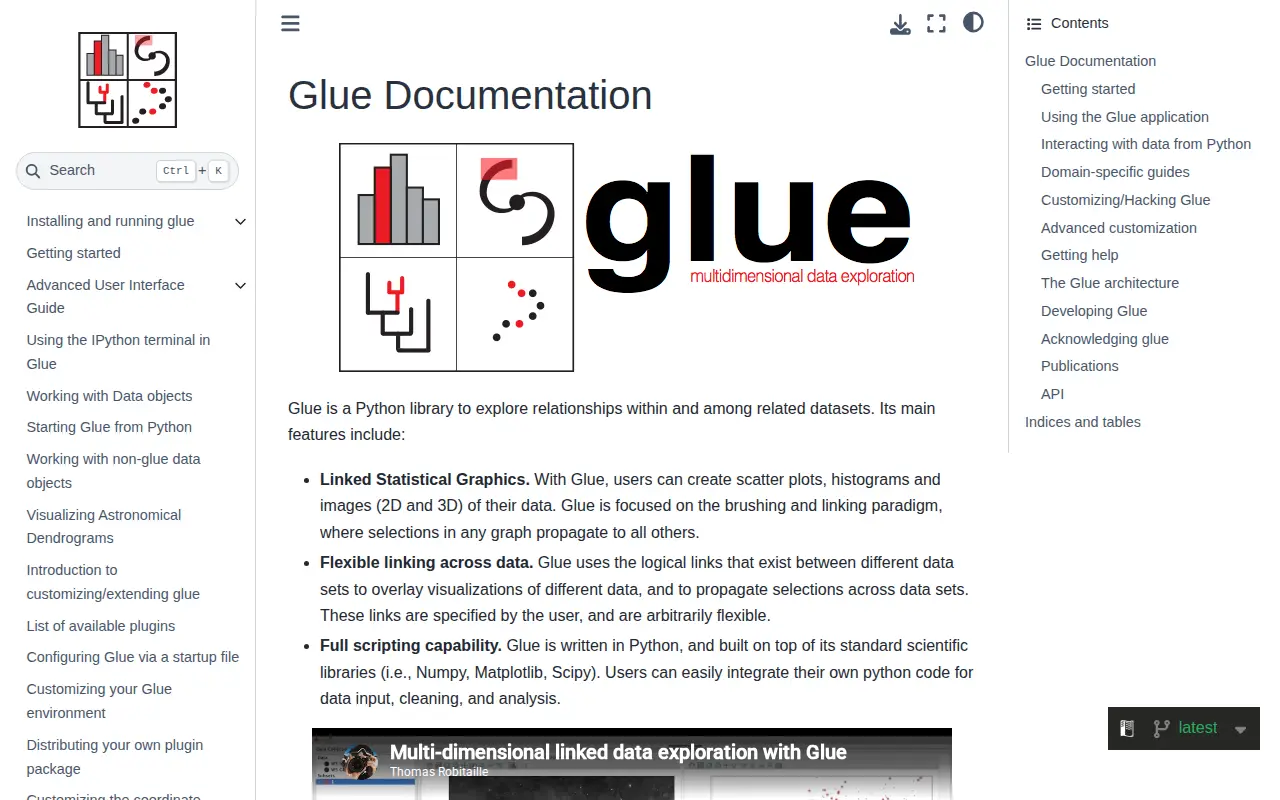
Glue is a Python library for exploring relationships within and among related datasets. It provides linked statistical graphics such as scatter plots, histograms and 2D and 3D images, with selections in one graph propagating to others. It supports user-specified links across datasets and scripting through Python's scientific libraries.
Features
- Python library to explore relationships within and among related datasets Source: docs.glueviz.org
Links
Tags
-
0Ruffus is an open-source computation pipeline library for Python, used in science and bioinformatics. It is designed to automate scientific and other analyses with a lightweight, standard-Python syntax, and can be installed from the Python Package Index.
-
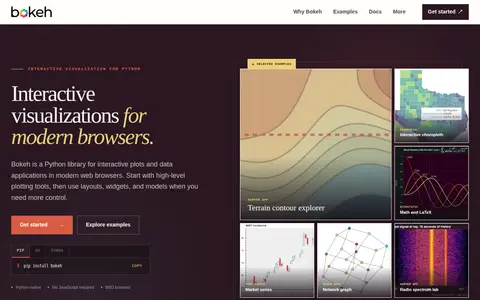
0Bokeh is a Python library for creating interactive plots, dashboards, and data applications in modern web browsers. Plots can go in Jupyter notebooks, be saved as standalone HTML, or run with live Python callbacks through the Bokeh server or embedded in an ASGI app. It includes tools for pan, zoom, hover, and selection.
-
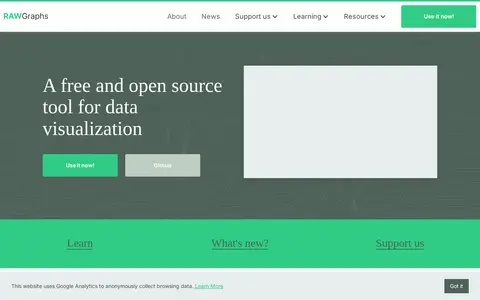
0RAWGraphs is a free and open source tool for data visualization. It is a web app that offers almost 30 visual models to visualize quantities, hierarchies and time series. Data inserted is processed only by the web browser, and projects can be saved or exported as vector or raster images.
-
0DataTalks.Club is an online community for data science professionals, ML engineers and AI practitioners. It offers free courses, weekly podcasts, webinars, workshops and book discussions, along with articles, a Slack group and a weekly newsletter. Events and podcast episodes cover topics such as machine learning, AI platforms and LLM engineering.
-
0
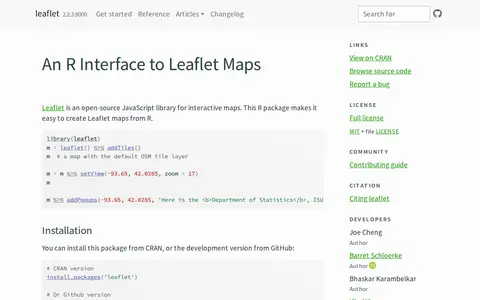
An R package that creates interactive Leaflet maps using the Leaflet JavaScript library and htmlwidgets. Maps can be used from the R console, RStudio, Shiny applications and R Markdown documents. It is linked to the open-source Leaflet JavaScript library for interactive maps.
-
0
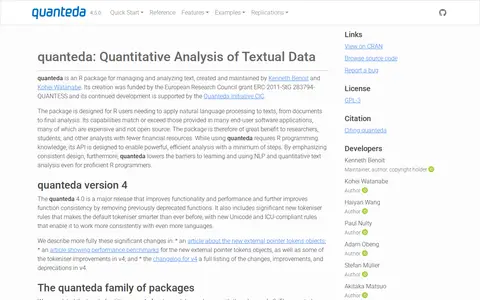
quanteda is an R package for managing and analyzing text, described as a fast, flexible, and comprehensive framework for quantitative text analysis in R. It provides functionality for corpus management, tokens and n-grams, keywords in context, sparse matrices, content dictionaries, and supervised and unsupervised machine learning.
Community notes
Reviews and discussion
No reviews yet
Be the first to share how this project worked for you.
Join the discussion
Sign in with a verified account to leave a review or join the discussion.
Sign in to review