github.com
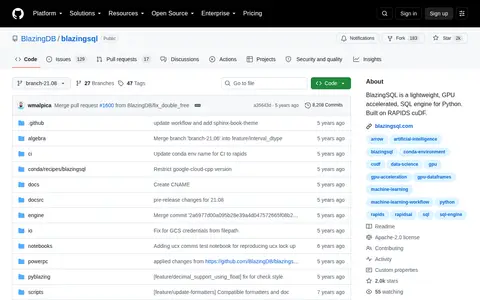
A lightweight, GPU accelerated, SQL engine for Python. Built on RAPIDS cuDF.
Directory
Published directory entries matching your search.
A lightweight, GPU accelerated, SQL engine for Python. Built on RAPIDS cuDF.

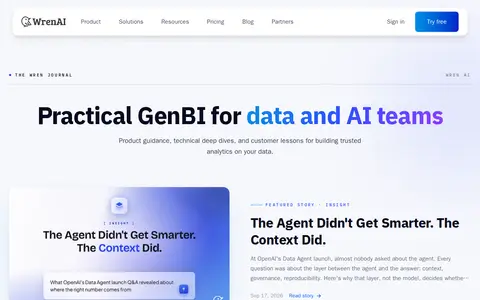
This is the official blog for Wren AI, which publishes practical guides covering GenBI, text-to-SQL, context layers, AI agents, embedded analytics, and secure self-hosted deployment for data teams. Posts include topics such as the role of context in AI agent performance and migrating open-source Wren projects to the cloud.

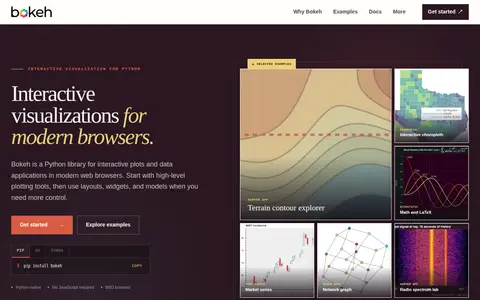
Bokeh is a Python library for creating interactive plots, dashboards, and data applications in modern web browsers. Plots can go in Jupyter notebooks, be saved as standalone HTML, or run with live Python callbacks through the Bokeh server or embedded in an ASGI app. It includes tools for pan, zoom, hover, and selection.

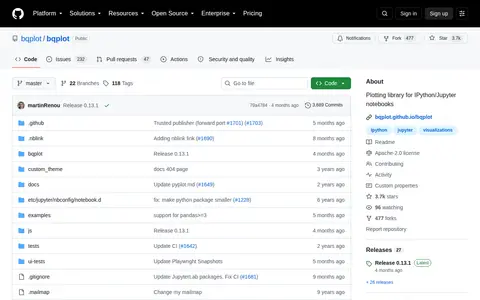
An API for plotting in Jupyter (IPython).

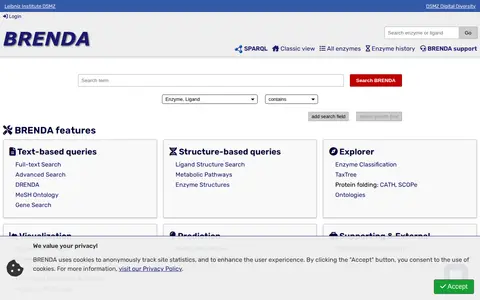
BRENDA is a comprehensive enzyme information system offering text-based and structure-based queries, an EC explorer, visualization, and prediction tools. It includes enzyme summary pages, ligand and tissue ontology searches, taxonomy and genome browsing, and pathway maps. The online version is free under the CC BY 4.0 license.

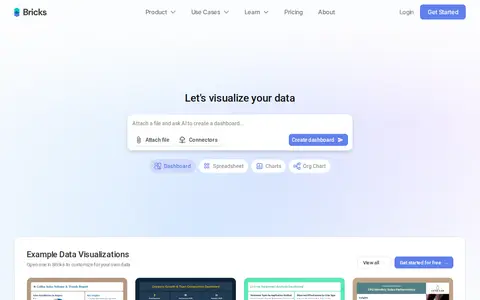
Bricks is an AI-powered workspace for organizing data, building dashboards, creating slides, and collaborating. It generates interactive dashboards from CSV and Excel data, and its documentation lists spreadsheets, live-updating dashboards, slides, and real-time collaboration.

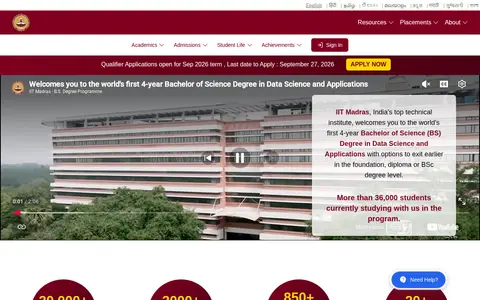
The Indian Institute of Technology Madras offers the BS in Data Science & Applications, a web-enabled undergraduate program focused on data science and programming. Learners may earn a Bachelor’s degree (BS or BSc, based on completed credits) or a diploma in Programming or Data Science upon successful completion of required courses. The program has no age limit, offers scholarships, and provides academic resources in multiple Indian languages.

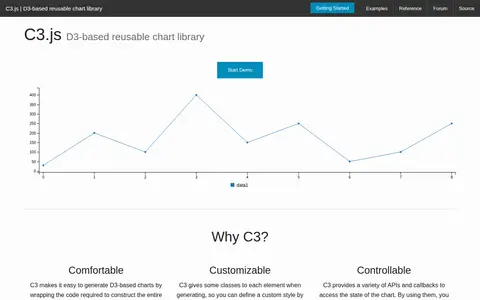
C3.js is a D3-based reusable chart library. It wraps the code required to construct entire charts, gives classes to elements for custom styling, and provides APIs and callbacks to access chart state and update charts after rendering.

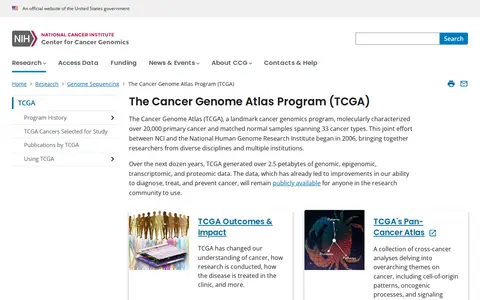
The Cancer Genome Atlas (TCGA) is an NCI and National Human Genome Research Institute program that molecularly characterized over 20,000 primary cancer and matched normal samples spanning 33 cancer types. TCGA data are publicly available and accessible through the Genomic Data Commons Data Portal, which provides web-based analysis and visualization tools.

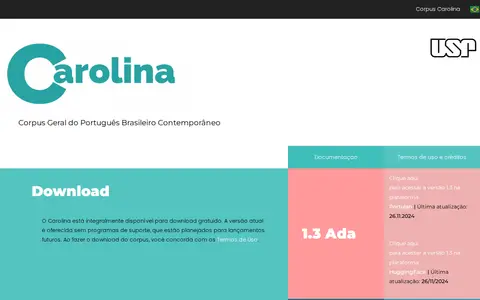
General Corpus of Contemporary Brazilian Portuguese with provenance and typology information - Corpus Geral do Português Brasileiro Contemporâneo.

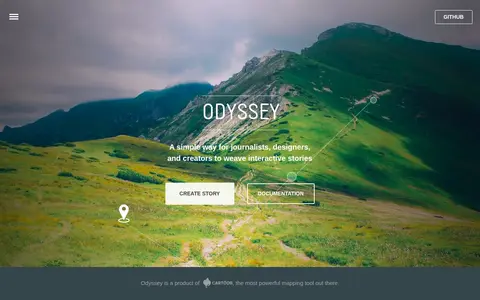
Odyssey.js is an open source tool that combines maps, narratives and other multimedia into stories. It offers templates including scrolling, slide based and temporal designs, and Actions for map movements and content display. The sandbox lets users test the library and edit story content with Markdown. It is an early-stage project developed by cartodb.com with Knight Foundation funding.
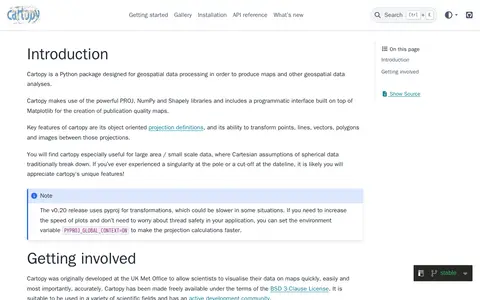
Cartopy is a Python package designed for geospatial data processing in order to produce maps and other geospatial data analyses.
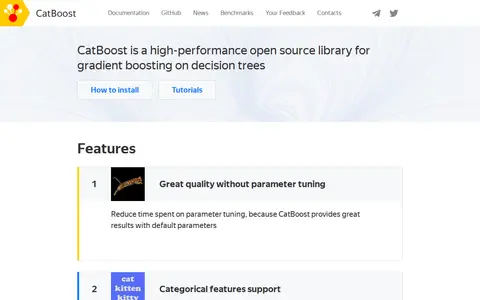
CatBoost is an open-source gradient boosting library on decision trees, developed by Yandex as the successor to its MatrixNet algorithm. It natively supports categorical features without preprocessing, offers a fast GPU implementation for large datasets, and reduces overfitting via a proprietary gradient boosting scheme. The library is used for tasks including search, recommendation systems, and weather prediction at Yandex.

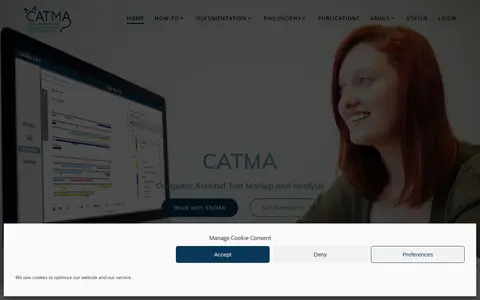
CATMA (Computer Assisted Text Markup and Analysis) is a free, browser-based tool for annotating, analyzing, interpreting and visualizing text. It supports collaborative project work, custom tagset creation, and offers TEI-XML export, Git access, a GitMA Python package, and a JSON API for data access. Users can generate interactive visualizations including word clouds and distribution graphs.

Celestia is a free space simulator that provides real-time 3D visualization of space. It displays objects and orbits based on scientific data and runs on Windows, Linux, macOS, iOS and Android. Users can travel through the solar system, to over 100,000 stars, or beyond the galaxy. Its catalogues are expandable with add-ons, and users can create their own objects and planetary systems.

The Cell Centered Database is an archived UC San Diego Library digital collection of high resolution 2D, 3D and 4D data from light and electron microscopy of tissues from the nervous system and other systems. It provides raw data, reconstructions and segmented data for download, plus 2D images, animations and image maps for online visualization.

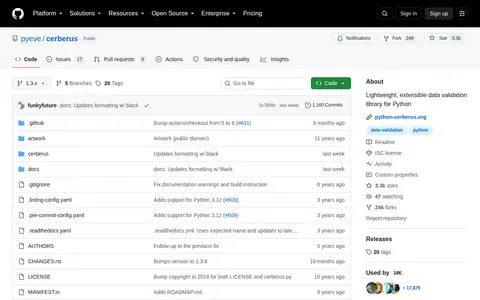
Cerberus is a lightweight and extensible data validation library for Python. It provides type checking and other base functionality out of the box, is designed to be non-blocking and extensible for custom validation, and has no dependencies. It is available on PyPI and maintained according to semantic versioning since version 1.2.
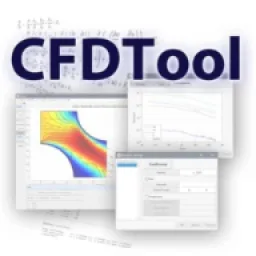
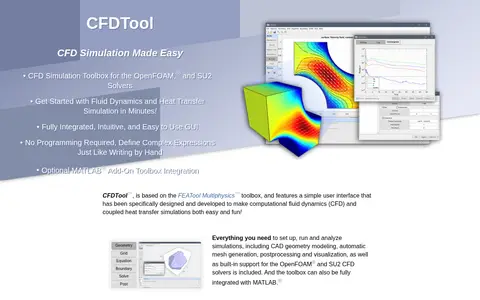
CFDTool is a graphical user interface toolbox based on the FEATool Multiphysics toolbox for computational fluid dynamics and coupled heat transfer simulations. It includes CAD geometry modeling, automatic mesh generation, postprocessing and visualization, and support for the OpenFOAM and SU2 solvers. Models can be defined once and used with the solvers interchangeably. It can be integrated with MATLAB.

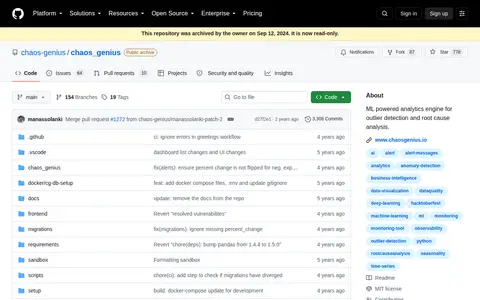
ML powered analytics engine for outlier/anomaly detection and root cause analysis.

Chart.js is an open source JavaScript charting library for the modern web, described as simple yet flexible. It supports eight animated and customisable chart types and renders on HTML5 Canvas across modern browsers, redrawing charts on window resize. Version 4.0 added a colors plugin and tree-shaking to reduce bundle size.

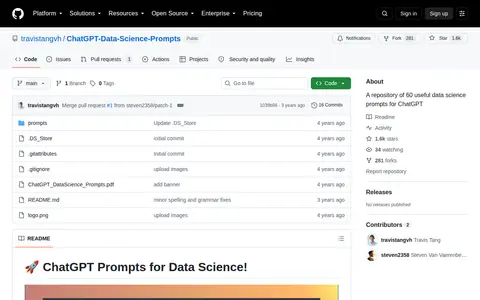
ChatGPT Prompts for Data Science is a GitHub repository containing 60 useful prompts for data science tasks. It includes prompts for writing Python code, automatic machine learning, and other data science workflows.
cheminfo.org is a website offering a collection of utilities for chemistry and related fields. Tools include NMR spectrum analysis, mass spectrometry, JSON conversion, and image processing. The site also provides exercises and simulators for spectral interpretation.

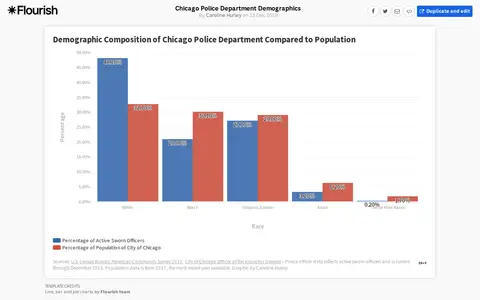
Flourish visualization of Chicago Police Department demographic data and workforce composition.
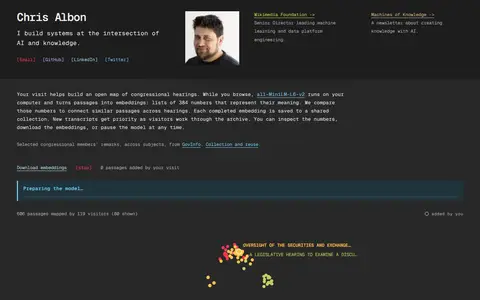
A personal website of Chris Albon. While browsing, the all-MiniLM-L6-v2 model runs on the visitor's computer and turns passages from congressional hearings into 384-number embeddings, which are compared to connect similar passages. Completed embeddings are saved to a shared collection, and visitors can inspect the numbers, download embeddings or pause the model.