asl-lex.org
Visualization provides educational videos, lessons, tutorials, or self-learning resources.
Directory
Published directory entries matching your search.
Visualization provides educational videos, lessons, tutorials, or self-learning resources.
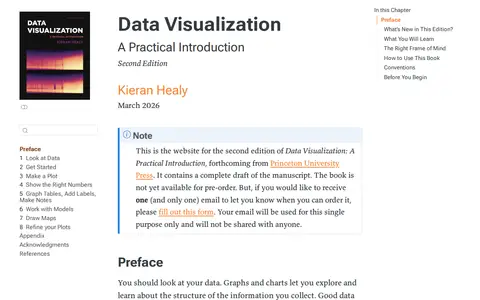
This is the website for the second edition of Data Visualization: A Practical Introduction by Kieran Healy, forthcoming from Princeton University Press. It contains a complete draft of the manuscript, and the book is not yet available for pre-order. According to the preface, the book teaches the ideas and methods of data visualization in a reproducible way.

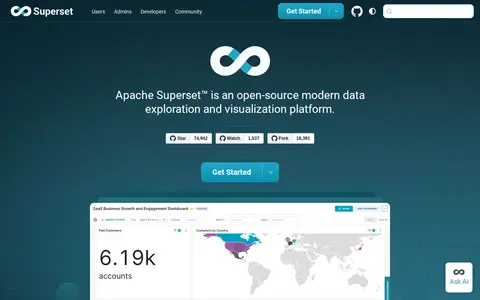
Apache Superset is an open-source data exploration and visualization platform. It offers a no-code visualization builder and a SQL IDE, connects to SQL-based databases, and ships with more than 40 pre-installed visualization types. It includes dashboards, a chart builder, SQL Lab and datasets, with a plug-in architecture for custom visualizations.

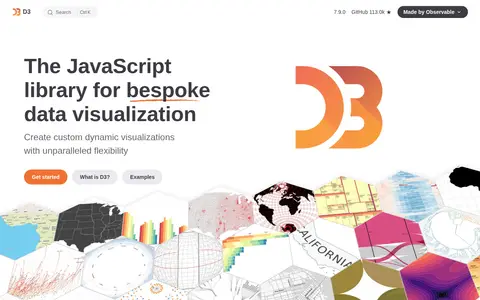
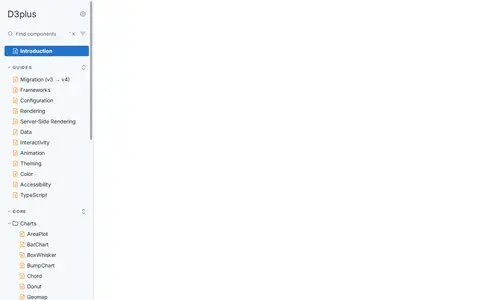
D3.js is a JavaScript library for bespoke data visualization developed by Observable. It enables creation of custom dynamic visualizations with features including selections and transitions, scales and axes, shape rendering, interactive behaviors, layout algorithms, and geographic map projections. The library also powers Observable Plot, a high-level visualization API.
Data Structure Visualizations provides educational videos, lessons, tutorials, or self-learning resources.

Data Visualization Ai Excel Togetherai E2b is a Hugging Face Space created by user Akshayram1. It allows users to upload CSV datasets, ask questions about the data, and receive AI-generated analysis and corresponding visualizations in response.

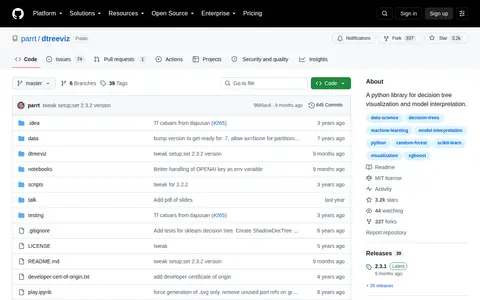
dtreeviz is a Python library for decision tree visualization and model interpretation. It supports scikit-learn, XGBoost, Spark MLlib, LightGBM and TensorFlow, and uses an adaptor object obtained from dtreeviz.model() to extract model information for visualization.

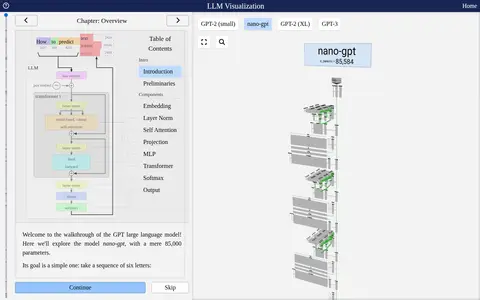
LLM Visualization is an AI chat or model resource for writing, coding, research, prompts, and assistant workflows.

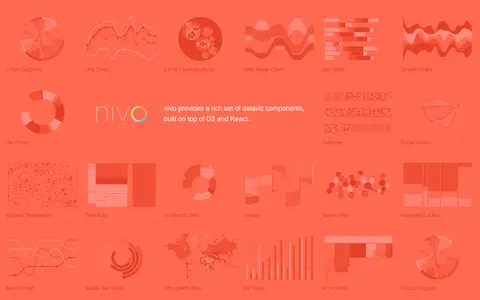
Nivo is a library of React data visualization components built on top of D3 and React. It provides a range of dataviz components including chord diagrams, line charts, bar charts, pie charts, choropleth maps and other visualization types.
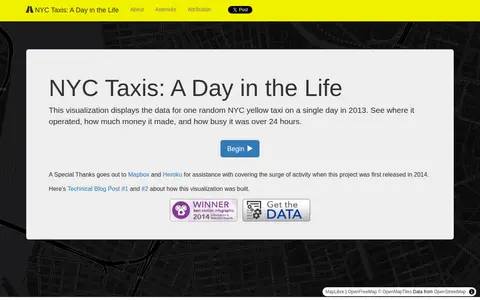
A data visualization by Chris Whong showing the activities of one random NYC yellow taxi on a single day in 2013, including where it operated and how much money it made. It uses taxi trip data provided by the Taxi and Limousine Commission via a FOIL request. Trip routes were produced with Google's Directions API and are not assumed accurate.

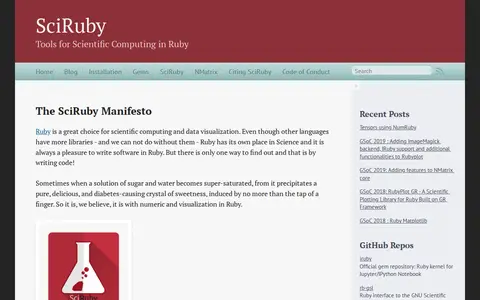
SciRuby is a project providing tools for scientific computing and data visualization in Ruby. Its releases include NMatrix, a linear algebra library with dense and sparse matrix storage and tensor support, alongside visualization and statistics gems. The project describes itself as currently alpha, and it notes its gems are tested but not battle-hardened. SciRuby and NMatrix are available under the BSD three-clause license.

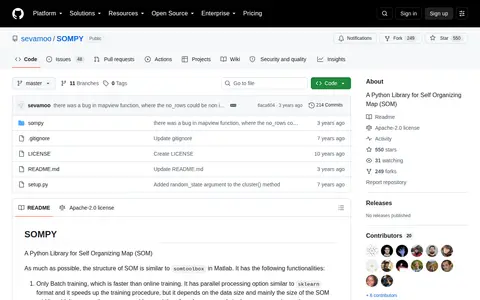
SOMPY is a Python library for self-organizing maps structured similarly to somtoolbox in Matlab. It offers only batch training, PCA or RandomPCA initialization, component plane visualization, hitmap and U-Matrix visualization, and 1-d or 2-d SOM with rectangular, planar grid. It supports function approximation and predictions, mostly using Sklearn.

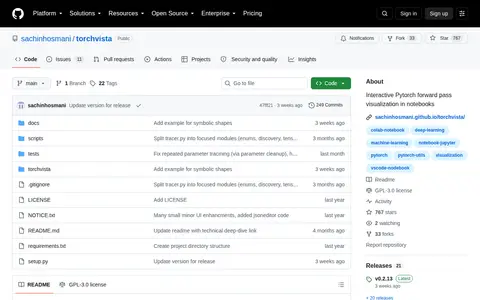
torchvista is an open-source tool that enables interactive visualization of PyTorch forward passes in Jupyter notebooks, maintained as a public GitHub repository under the sachinhosmani organization. It supports interactive drag-and-zoom graphs, collapsible nodes for hierarchical modules, and error-tolerant partial visualization when errors arise.

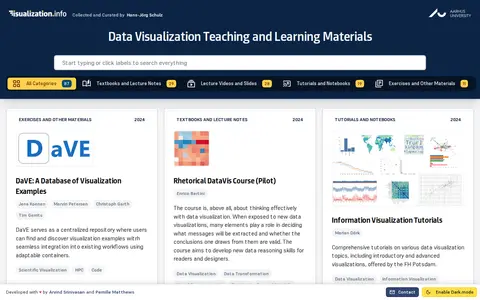
Visualization.info provides educational videos, lessons, tutorials, or self-learning resources.

Open-source project that applies AI to data analysis, extraction, visualization, or business intelligence.

Open-source project that applies AI to data analysis, extraction, visualization, or business intelligence.

Amundsen applies AI to data analysis, extraction, visualization, or business intelligence.

Open-source project that applies AI to data analysis, extraction, visualization, or business intelligence.

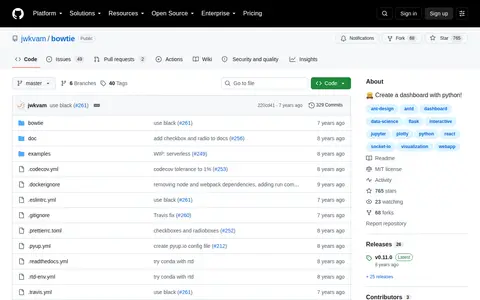
Bowtie is a library for writing dashboards in Python. It wraps the code needed for interactive data exploration and visualization, so users can build functionality without knowing web frameworks or JavaScript. It can be installed with conda or pip, and Docker images are provided.

An open-source JavaScript visualization library that streamlines the creation of beautiful and accessible SVG data visualizations.

Data Science Toolbox applies AI to data analysis, extraction, visualization, or business intelligence.

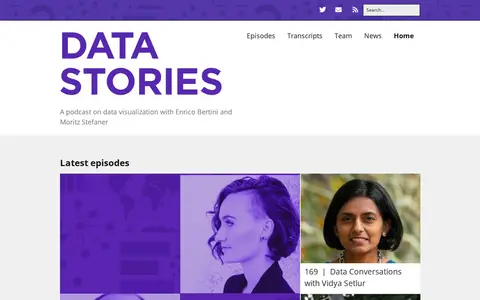
A podcast on data visualization hosted by Enrico Bertini and Moritz Stefaner. The site lists episode archives, news items and classics, and notes that transcriptions of 170 episodes were produced with Miska Knapek.

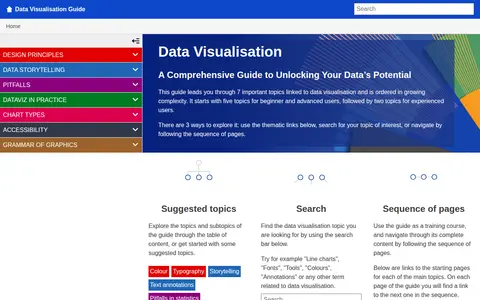
A guide on the data.europa.eu portal covering data visualisation across seven topics ordered by growing complexity. It offers thematic links, a search bar and a sequence of pages for navigating the content.

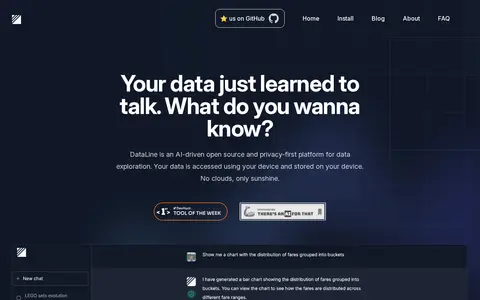
DataLine is an AI data analysis and visualization tool that lets users chat with their data to generate tables, charts, and dashboards. The page describes it as suited to non-technical people querying data and to developers seeking a text2sql solution.