



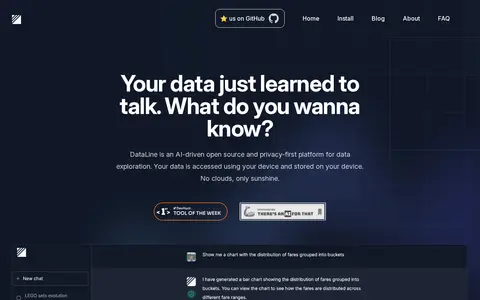

DataLine is an AI data analysis and visualization tool that lets users chat with their data to generate tables, charts, and dashboards. The page describes it as suited to non-technical people querying data and to developers seeking a text2sql solution.
Bricks
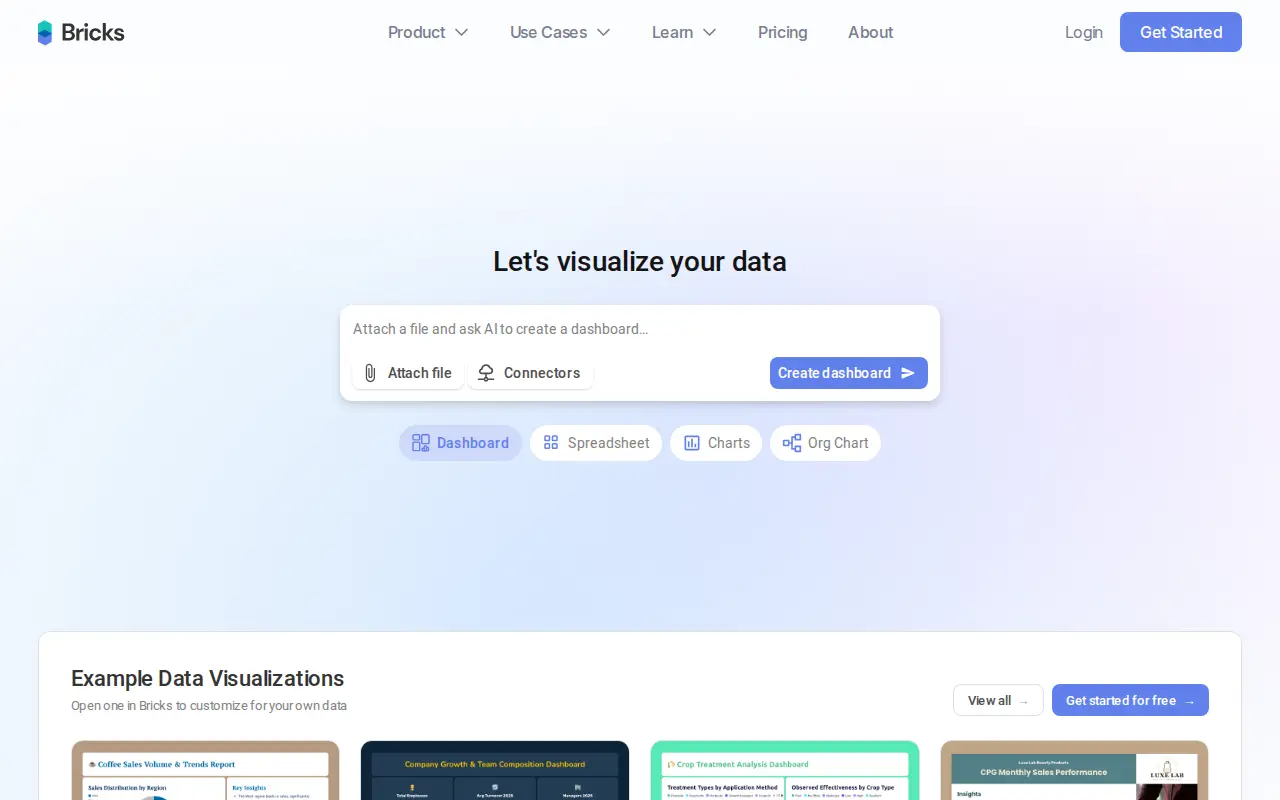
Bricks is an AI-powered workspace for organizing data, building dashboards, creating slides, and collaborating. It generates interactive dashboards from CSV and Excel data, and its documentation lists spreadsheets, live-updating dashboards, slides, and real-time collaboration.
Features
- organize data, build dashboards, create slides, and collaborate Source: www.thebricks.com
Links
Tags
-
0DataLine is an AI data analysis and visualization tool that lets users chat with their data to generate tables, charts, and dashboards. The page describes it as suited to non-technical people querying data and to developers seeking a text2sql solution.

-
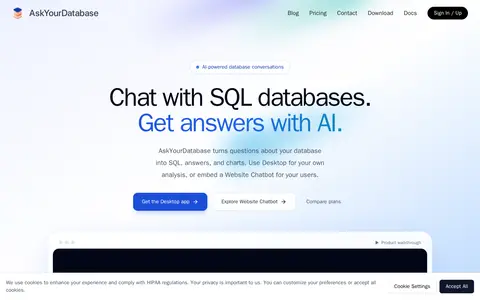
0AskYourDatabase is a tool for querying SQL databases in natural language, returning SQL, answers, and charts. It supports PostgreSQL, MySQL, SQL Server, BigQuery, Snowflake, and other engines. Offerings include a Windows or macOS desktop app, an embeddable website chatbot, a dashboard builder, and a private deployment option for organizations with hosting or data-handling requirements.
-
0Data Studio is a web-based reporting tool for building interactive dashboards and reports. It offers built-in and partner connectors to access many kinds of data, and allows reports and dashboards to be shared with individuals, teams or the public, embedded on web pages, and viewed in a gallery. The page states it is easy and free to use.
-
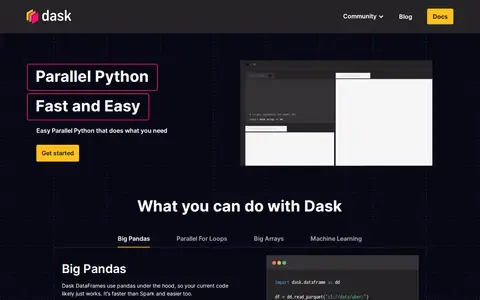
0Dask is an open-source Python library for parallel computing maintained by contributors across dozens of companies. The site describes uses including Dask DataFrames for pandas, parallel for loops, large arrays with NumPy and Xarray, and machine learning. It can run on a laptop or be deployed on resource managers such as Kubernetes or cloud.
-
0The Master of Management Analytics at Smith School of Business, Queen's University, combines data analytics training with business strategy and management education. It is offered in a live classroom format in downtown Toronto and a blended format with online learning and live remote instruction, and includes two one-week on-site sessions.
-
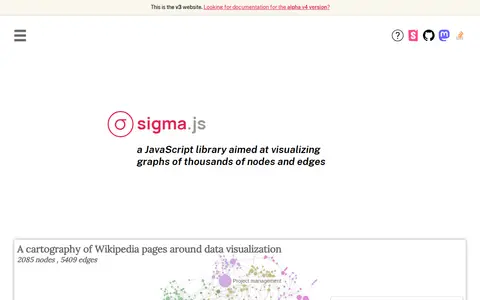
0Sigma.js is a WebGL-powered JavaScript library for interactive graph visualization, built on graphology. It provides GPU-accelerated rendering, built-in pan, zoom, hover and multi-touch interactions, and works with React, Angular, Vue or vanilla JavaScript. Layouts, metrics and community detection come via graphology's standard library.
Community notes
Reviews and discussion
No reviews yet
Be the first to share how this project worked for you.
Join the discussion
Sign in with a verified account to leave a review or join the discussion.
Sign in to review