


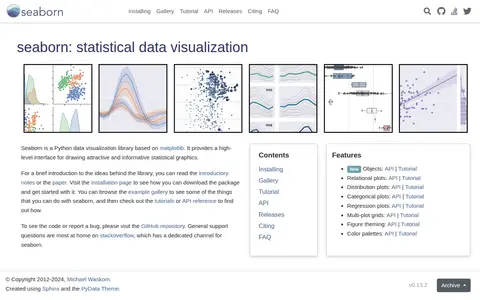
Seaborn is a Python data visualization library based on matplotlib. It provides a high-level interface for drawing statistical graphics, and covers relational, distribution, categorical, regression and multi-plot grids, along with figure theming and color palettes.
bokeh
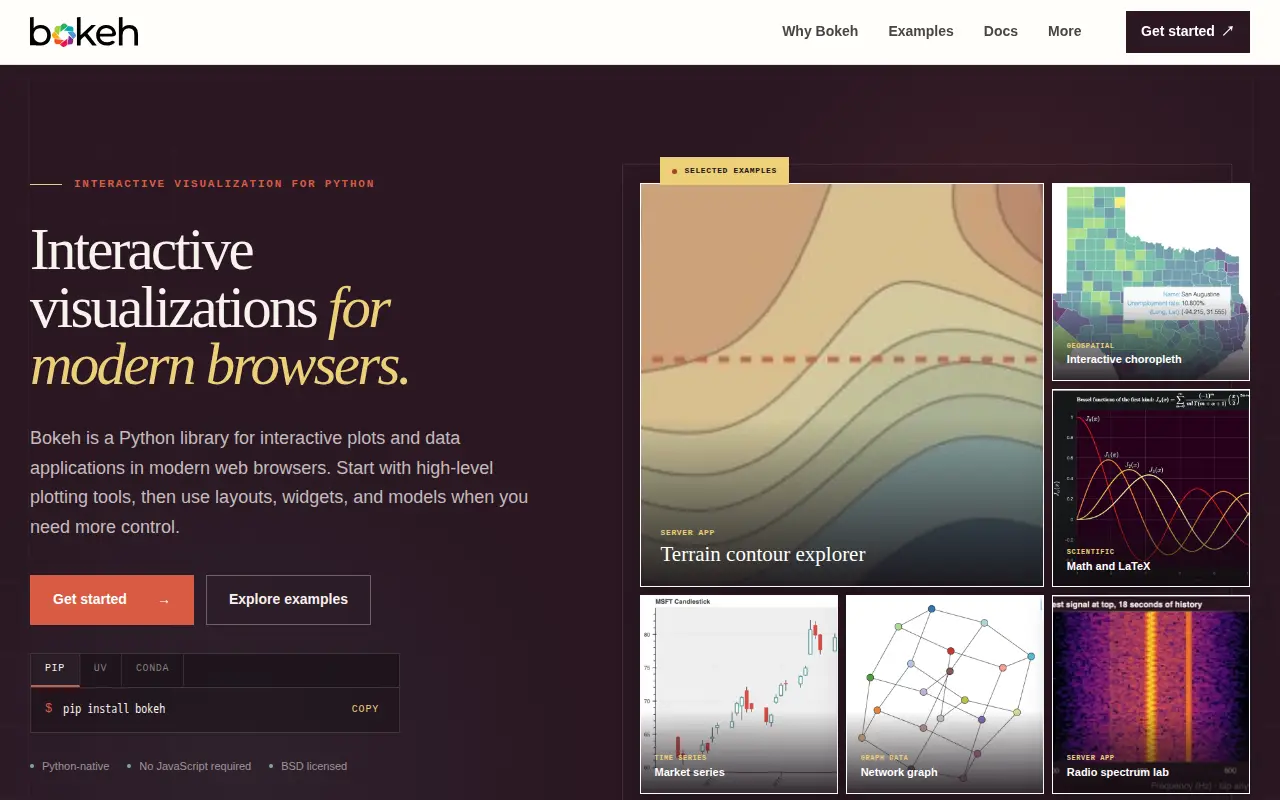
Bokeh is a Python library for creating interactive plots, dashboards, and data applications in modern web browsers. Plots can go in Jupyter notebooks, be saved as standalone HTML, or run with live Python callbacks through the Bokeh server or embedded in an ASGI app. It includes tools for pan, zoom, hover, and selection.
Features
- Python library for interactive plots and data applications in modern web browsers Source: bokeh.org
Uses
- tools for pan, zoom, hover, and selection Source: bokeh.org
Links
Tags
-
0Seaborn is a Python data visualization library based on matplotlib. It provides a high-level interface for drawing statistical graphics, and covers relational, distribution, categorical, regression and multi-plot grids, along with figure theming and color palettes.
-
0Ruffus is an open-source computation pipeline library for Python, used in science and bioinformatics. It is designed to automate scientific and other analyses with a lightweight, standard-Python syntax, and can be installed from the Python Package Index.
-
0Shiny is an R and Python package for creating interactive web apps, letting users interact with data and analysis without web development skills. Apps can be written from R or Python. Questions are answered through Posit Community and Stack Overflow, with subscription support for hosting services.
-
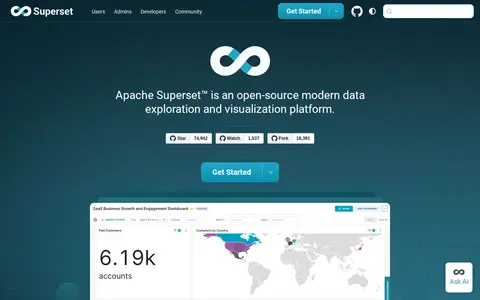
0Apache Superset is an open-source data exploration and visualization platform. It offers a no-code visualization builder and a SQL IDE, connects to SQL-based databases, and ships with more than 40 pre-installed visualization types. It includes dashboards, a chart builder, SQL Lab and datasets, with a plug-in architecture for custom visualizations.
-
0Chart.js is an open source JavaScript charting library for the modern web, described as simple yet flexible. It supports eight animated and customisable chart types and renders on HTML5 Canvas across modern browsers, redrawing charts on window resize. Version 4.0 added a colors plugin and tree-shaking to reduce bundle size.
-
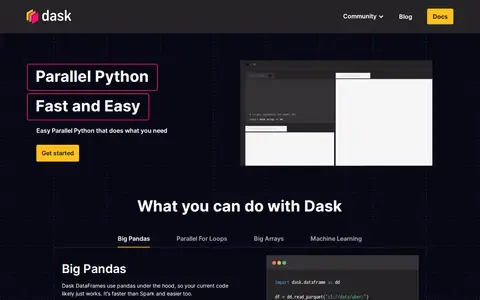
0Dask is an open-source Python library for parallel computing maintained by contributors across dozens of companies. The site describes uses including Dask DataFrames for pandas, parallel for loops, large arrays with NumPy and Xarray, and machine learning. It can run on a laptop or be deployed on resource managers such as Kubernetes or cloud.
Community notes
Reviews and discussion
No reviews yet
Be the first to share how this project worked for you.
Join the discussion
Sign in with a verified account to leave a review or join the discussion.
Sign in to review