



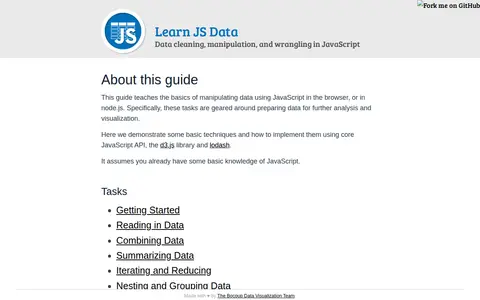
A guide that introduces data processing and cleaning in JavaScript, teaching how to load, modify and transform data using JavaScript libraries. It covers tasks geared around preparing data for further analysis and visualization, demonstrated with core JavaScript API, d3.js and lodash. It assumes some basic knowledge of JavaScript.
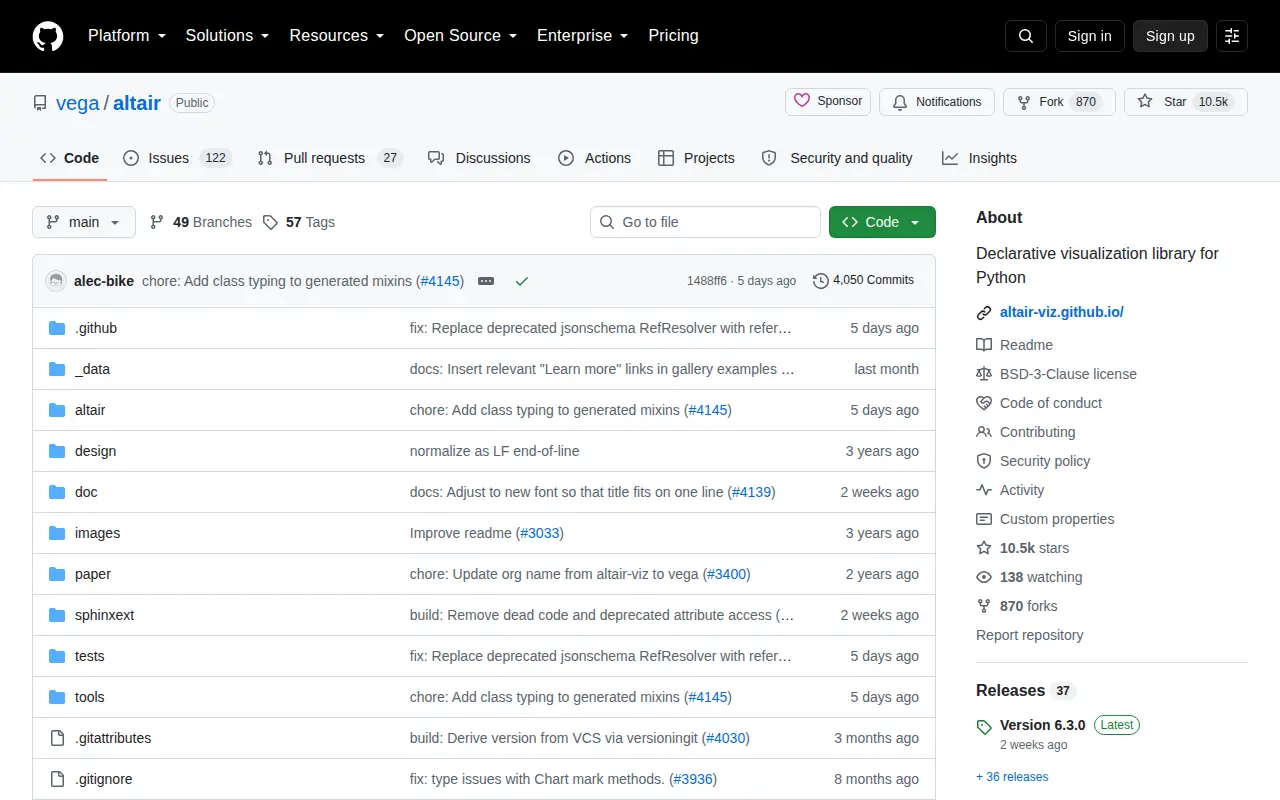
altair
Open-source project that applies AI to data analysis, extraction, visualization, or business intelligence.
Links
Tags
-
0A guide that introduces data processing and cleaning in JavaScript, teaching how to load, modify and transform data using JavaScript libraries. It covers tasks geared around preparing data for further analysis and visualization, demonstrated with core JavaScript API, d3.js and lodash. It assumes some basic knowledge of JavaScript.
-
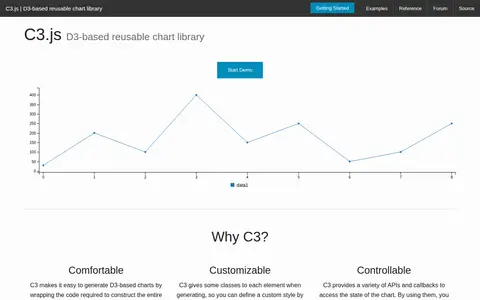
0C3.js is a D3-based reusable chart library. It wraps the code required to construct entire charts, gives classes to elements for custom styling, and provides APIs and callbacks to access chart state and update charts after rendering.
-
0An article comparing Topological Data Analysis results with those from t-SNE and UMAP packages. It discusses advantages of TDA coupled with self-supervised learning and covers case studies in IoT, image analysis and text analysis, plus open-source libraries for starting with TDA.
-
0The Data Engineering Show is a podcast for data engineering and BI practitioners. It features discussions with tech influencers about practical day-to-day data challenges and solutions. Episodes are available on platforms including Apple Podcasts, Spotify and Pocket Casts.
-
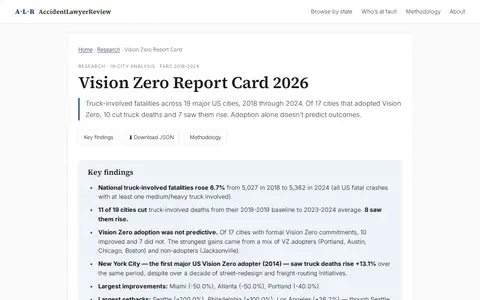
0Research report examining seven years of truck-involved fatalities, 2018 through 2024, across 19 major US cities, based on FARS data. It compares each city's 2018-2019 baseline average with its 2023-2024 average and notes that of 17 Vision Zero adopters, 10 improved and 7 did not.
-
0
The Quiet-Broke Index is a research project modeled by Henry Finance that estimates the high-earner squeeze across 30 US metros at a $400,000 household income. It combines five fixed costs: housing, taxes, childcare, healthcare and transportation. A calculator gives a 0–100 score from five inputs, and the site ranks cities and reports per-line-item decomposition.
Community notes
Reviews and discussion
No reviews yet
Be the first to share how this project worked for you.
Join the discussion
Sign in with a verified account to leave a review or join the discussion.
Sign in to review