


hama.apache.org
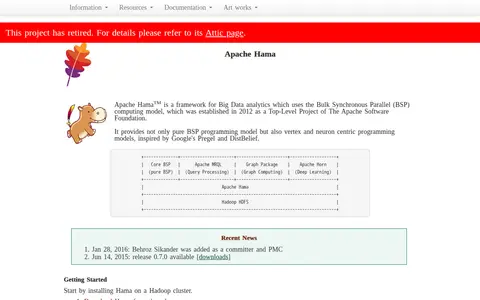
Apache Hama is a retired Apache Software Foundation Top-Level Project established in 2012. It is a framework for Big Data analytics that uses the Bulk Synchronous Parallel (BSP) computing model. It also provides vertex-centric and neuron-centric programming models inspired by Google's Pregel and DistBelief. Its components include core BSP, Apache MRQL for query processing, a graph computing package, and Apache Horn for deep learning, and it integrates with Hadoop HDFS.