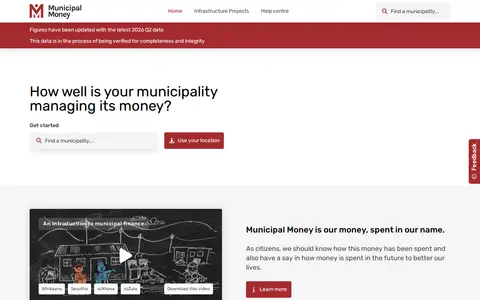

Municipal Money is a web-based tool from South Africa's National Treasury that presents municipal financial data to the public. It draws on raw data from the Municipal Money API site and uses interactive maps, charts, graphs and short videos to show financial performance and allow comparisons between municipalities. Content is presented for general audiences without a financial background.
Directory
Search results
Published directory entries matching your search.
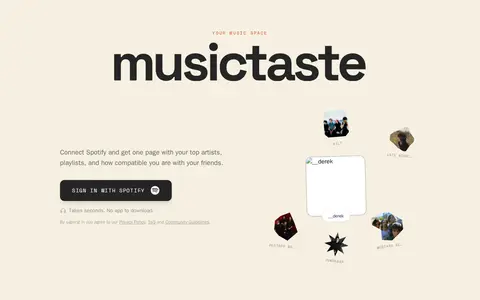
MusicTaste generates a shareable page from a connected Spotify account showing top artists, playlists and compatibility with friends. It includes hand-arranged album art collages and community features such as the 1 Track Club and monthly musictaste charts.
Nansen provides on-chain analytics, dashboards, and crypto market intelligence for research.
Nansen Portfolio helps track crypto portfolios, balances, market prices, and performance across assets.
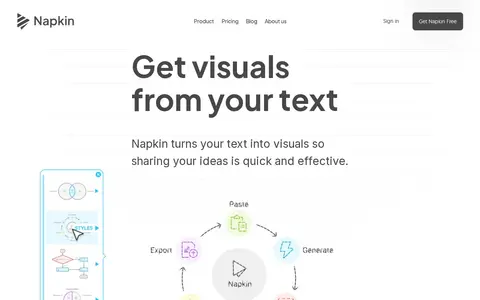
Napkin AI is a tool that turns pasted text into visuals such as flowcharts, mind maps, infographics, diagrams, data charts and slides, without design skills. Users generate visuals from their text, then adjust colors and elements. Visuals can be exported as .ppt, .png, .pdf or .svg. A free plan offers 500 AI credits per week, and pricing lists Plus at $9 per person per month.
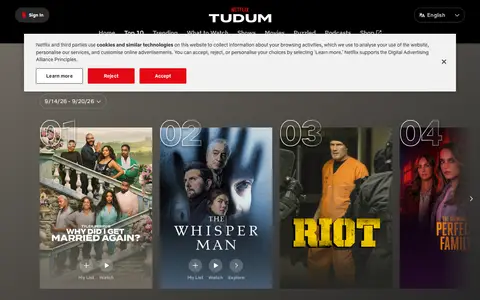
Netflix's weekly ranking of its most-watched films and series, with global charts and country-level viewing lists.
The Newfoundland and Labrador Open Data portal releases government datasets under an open licence, free of charge for anyone to use and reuse for any purpose. It offers tabular and spatial dataset catalogs, tags for finding data by topic, and charts and maps built from individual datasets. Data is provided in accessible, machine-readable formats such as XLS, CSV and TXT.
A website for organizing and tracking TV series and movies. Users add shows to a Watchlist, which shows new episodes and arranges them in a TV calendar. It also offers recommendations based on watched shows and top charts with trailers.
ArcGIS Hub site for discovering, analyzing and downloading data. Data can be downloaded in CSV, KML, Zip, GeoJSON, GeoTIFF or PNG formats, and API links are provided for GeoServices, WMS and WFS. Charts and thematic maps are available for analysis, and users can create StoryMaps and Web Maps.
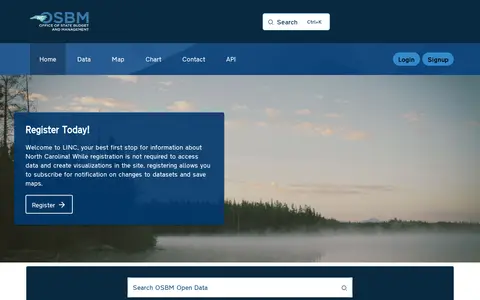
The North Carolina Open Data Portal is operated by the North Carolina Office of State Budget and Management (OSBM). It provides public access to state datasets, with features including data maps, charts, and API access.
An ArcGIS Hub open data portal for North Lanarkshire Council. It offers data discovery, analysis and download in formats including CSV, KML, Zip, GeoJSON, GeoTIFF and PNG, with API links for GeoServices, WMS and WFS. Users can analyze data with charts and thematic maps and create StoryMaps and Web Maps.
OilPrice.com provides crude oil and gas price charts for Brent Crude, WTI and oil futures, along with energy news covering oil, petroleum and natural gas. The site also publishes editorials, interviews and geopolitics coverage.
Mermaid live editor for writing diagrams, flowcharts, sequence charts, and visual documentation.
Open Data for Kilgore, also known as Kilgore GIS Hub, provides geospatial data for download in formats like CSV, KML, Zip, GeoJSON, GeoTIFF, and PNG. It offers API links for GeoServices, WMS, and WFS, and supports analysis with charts and thematic maps, as well as creation of StoryMaps and Web Maps.
Open data of the City municipality of Ljubljana is a public data portal for the City Municipality of Ljubljana. It enables users to discover, analyze and download datasets in formats including CSV, KML, Zip, GeoJSON, GeoTIFF and PNG. The portal offers API links for GeoServices, WMS and WFS, supports analysis with charts and thematic maps, and allows creation of StoryMaps and Web Maps.
Open Penticton is a public data platform that allows users to discover, analyze and download datasets. Available download formats include CSV, KML, Zip, GeoJSON, GeoTIFF and PNG. The platform provides API links for GeoServices, WMS and WFS, and supports creating charts, thematic maps, StoryMaps and Web Maps.
ArcGIS Hub site for discovering, analyzing and downloading data. It supports downloads in CSV, KML, Zip, GeoJSON, GeoTIFF and PNG formats, provides API links for GeoServices, WMS and WFS, and offers analysis with charts and thematic maps.
An ArcGIS Hub open data portal from Ottawa Riverkeeper for discovering, analyzing and downloading data. Data can be downloaded in CSV, KML, Zip, GeoJSON, GeoTIFF or PNG, and API links are provided for GeoServices, WMS and WFS. Analysis is available through charts and thematic maps, with options to create StoryMaps and Web Maps.
Plus is an AI assistant for PowerPoint and Google Slides that helps users create, refine and present presentations. It can generate slides from a prompt or an uploaded file, rewrite and reformat content, add images and charts, and work with custom templates and preset libraries.
The City of Port Moody's open data portal lets users discover, analyze and download city data. Data can be downloaded in formats including CSV, KML, Zip, GeoJSON, GeoTIFF and PNG. API links are provided for GeoServices, WMS and WFS, and users can analyze data with charts and thematic maps.
A portal for discovering, analyzing and downloading data from Prince Edward Island Open Data. The data can be downloaded in formats including CSV, KML, Zip, GeoJSON, GeoTIFF and PNG. API links are provided for GeoServices, WMS and WFS, and the data can be analyzed with charts, thematic maps, StoryMaps and Web Maps.
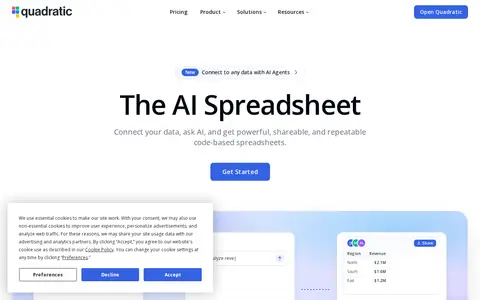
Quadratic is an AI-powered spreadsheet that connects to various data sources and provides fast, explainable insights. Users can ask questions in plain English and the AI generates formulas, code, and charts. It supports connections to CSVs, Excel, PDFs, and databases like Postgres and Google Analytics. The platform is used by over 250,000 people at companies and universities.
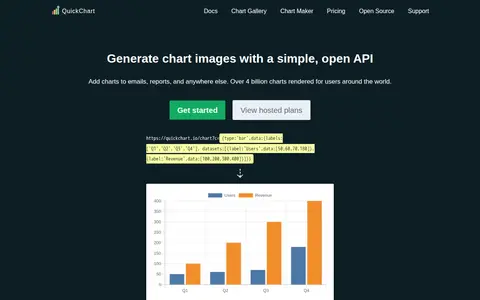
QuickChart is a web service that generates chart images on the fly from Chart.js configurations, suitable for embedding in email, SMS, chatbots and other formats. Charts are sent through a URL or POST request and rendered by the Chart.js library. It is dual licensed under the GNU AGPLv3 and a commercial license.
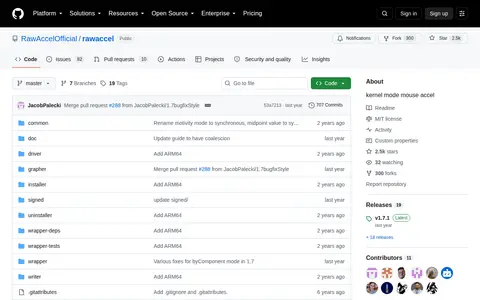
Raw Accel is a Windows 10 and Windows 11 x86-64 driver that accelerates mouse input in the raw input stream. It began as a replacement for InterAccel and has been extended with more acceleration types, charts and other features. Its releases are signed and run in system space, and it adds a one-second delay when settings change.