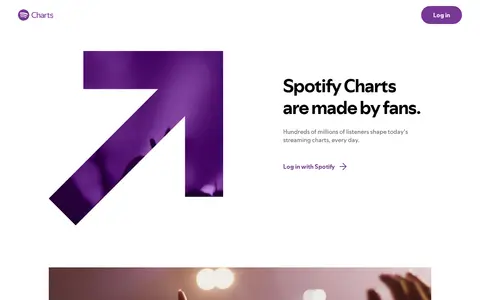
Spotify Charts displays streaming charts with artist, genre, city and local pulse views, showing what music is moving listeners worldwide. Logging in with a Spotify account gives access to global charts and additional charts for genres and cities. The site states that charts are shaped by hundreds of millions of listeners daily.
Directory
Search results
Published directory entries matching your search.
Charts Builder is an online service for working with the Google Charts API. The Google Chart API lets users dynamically generate charts, and the service allows updating input data and changing the style of a chart preview.
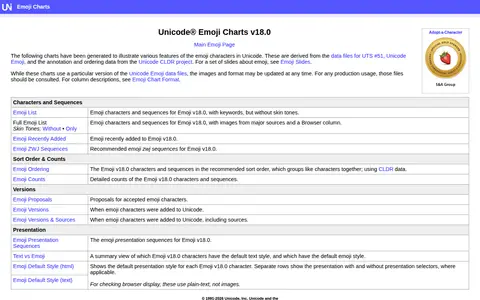
Unicode Emoji Charts presents charts illustrating features of emoji characters in Unicode, derived from UTS #51 data and the Unicode CLDR project. The charts include an emoji list, skin tones, counts and ordering.
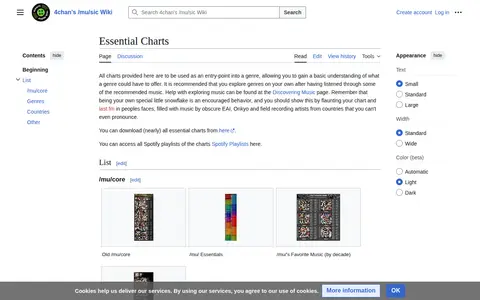
A wiki page collecting essential music charts intended as an entry point into a genre, offering a basic understanding of what a genre could offer. The page is organized into sections including /mu/core, genres, countries and other charts, and links to Spotify playlists of the charts.
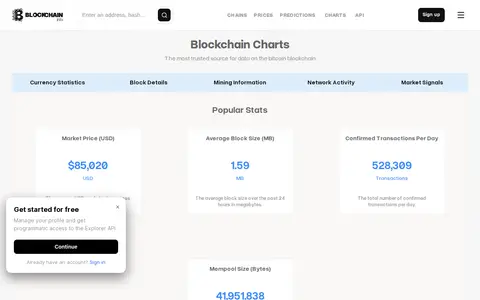
Blockchain Charts presents statistics and indicators for the bitcoin blockchain, including market price, blockchain size, mining information and network activity, along with popular stats and cycle indicators such as the 200 week moving average heatmap.
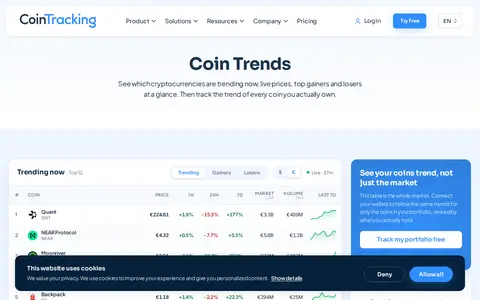
CoinTracking Charts helps track crypto portfolios, balances, market prices, and performance across assets.
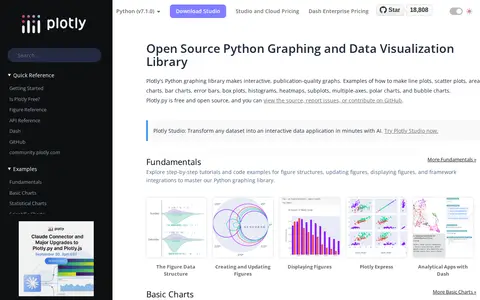
Plotly's Python graphing library is a free, open-source library for building interactive, publication-quality charts and graphs. It supports chart types including line plots, scatter plots, bar charts, error bars, box plots, histograms, heatmaps, subplots, multiple-axes, polar charts, and bubble charts. The source is available on GitHub.
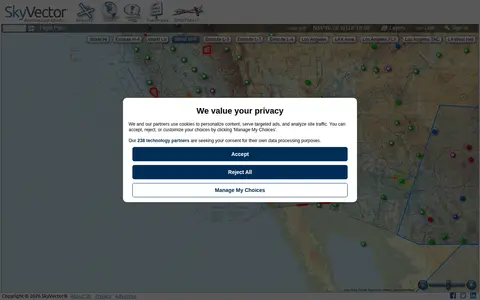
SkyVector is a free online flight planner founded in 2006. It offers aeronautical charts including Sectional Charts, Approach Plates, IFR Enroute Charts and Helicopter route charts, with weather data and fuel prices. Users can add their own fuel prices by sending CSV price lists to a personal email address after signing in.
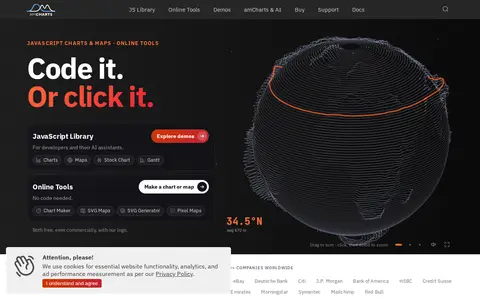
amCharts is a TypeScript library for JavaScript charts, offering 60+ chart types plus maps, stock charts, and Gantt charts. The site states the library is free to use and React-ready. Documentation lists React, Angular, Vue.js, Next.js, and other integrations.
Charts and Culture helps search books, ebooks, papers, library records, or reading archives.
High Charts is a JavaScript charting library designed for use in web applications, dashboards, grids and frameworks including React. It offers products for core charting, stock data, maps, Gantt charts, grids and dashboards, and is used by a large number of global enterprises. The library provides built-in adaptive functionality and extensive customization options for interactive data visualizations.
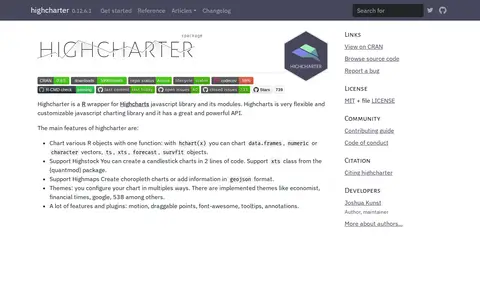
Highcharter is an R wrapper for the Highcharts JavaScript charting library and its modules, delivered through an htmlwidget. The hchart(x) function charts data frames, vectors, ts, xts, forecast and survfit objects. It supports Highstock candlestick charts, Highmaps choropleth charts, themes, and plugins. Highcharts offers a commercial license and a free non-commercial license; the package does not provide a Highcharts license.
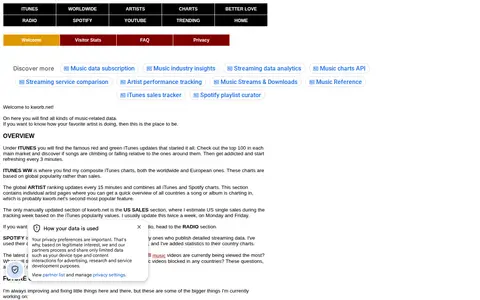
Kworb.net is a website that collects and analyzes music data from around the world, covering charts, sales and streams. Sections include iTunes charts, artist rankings, US sales estimates, radio, Spotify and YouTube. The site states that charts, sales and streams are constantly updated.
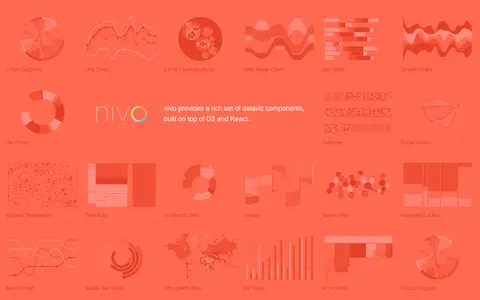
Nivo is a library of React data visualization components built on top of D3 and React. It provides a range of dataviz components including chord diagrams, line charts, bar charts, pie charts, choropleth maps and other visualization types.
RateYourMusic Charts is an audio or music resource for streaming, discovery, editing, production, or library management.
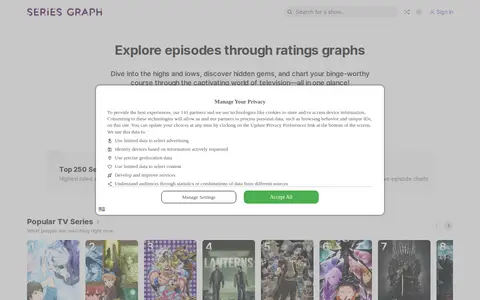
Series Graph displays television episode ratings as graphs, letting users explore highs and lows across a show. The site also features top series charts, community charts and lists, fan-made fictional charts with episode ratings, and tier lists, plus a Series Graph Plus offering.
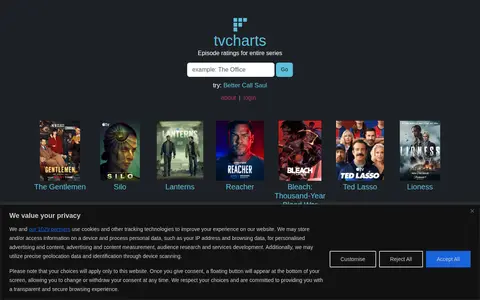
TV Charts is a television rating tracking tool. It allows users to search for current or past TV series and view IMDb ratings for every individual episode of a given show, presenting the episode-level rating data in chart format for the full series run.
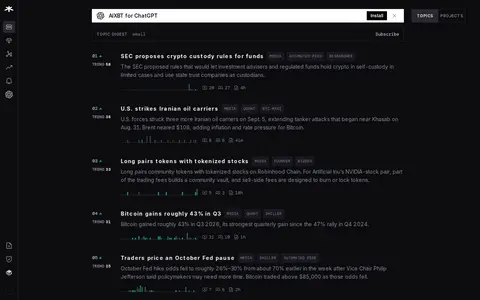
AIXBT provides crypto data, analytics, charts, and market intelligence for digital assets.
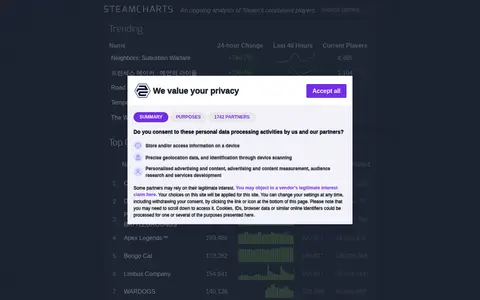
Steam Charts is a website that analyzes Steam player numbers and tracks which games have been played the most. It reports concurrent players, 24-hour changes, 30-day peaks, hours played and all-time peak player records. The site states that all data is powered by Steam and that it is not affiliated with Valve.
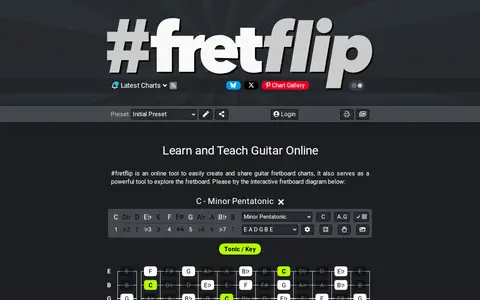
#fretflip is an online tool for creating and sharing guitar fretboard charts, and for exploring the fretboard. Content can be edited in a what-you-see-is-what-you-get manner, and shared charts are stored in the cloud and accessed by anyone in any browser using a generated URL.
AnyChart is a JavaScript charting library with an API and documentation. It offers a large number of chart types, and the site lists related products for stock charts, HTML5 maps and Gantt charts. Version 9.0.0 added chart types including arc diagram, dependency wheel, org chart, stream graph, waffle chart, lollipop and dumbbell. The library is described as working with any development stack.
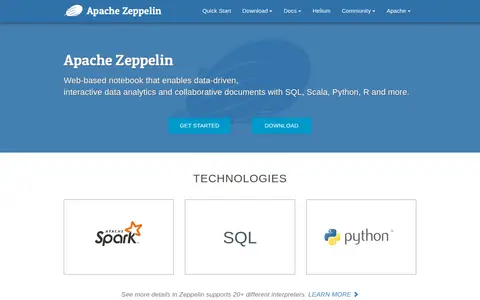
Apache Zeppelin is a web-based notebook for data-driven, interactive data analytics and collaborative documents with SQL, Scala, Python, R and more. It uses interpreters to plug in language and data-processing backends, including built-in Apache Spark integration, and includes basic charts, pivot charts, dynamic forms and paragraph publishing to embed results in websites.
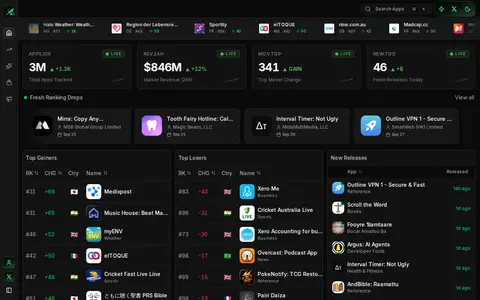
App Store Tracker records Apple's top free iPhone charts daily, including category charts in more than 100 countries and the overall US chart. It reports top gainers and losers as day-over-day rank changes, plus new releases from the last 7 days. A chart position is Apple's rank on that day, not a download count.
Artemis provides crypto data, analytics, charts, and market intelligence for digital assets.