
github.com
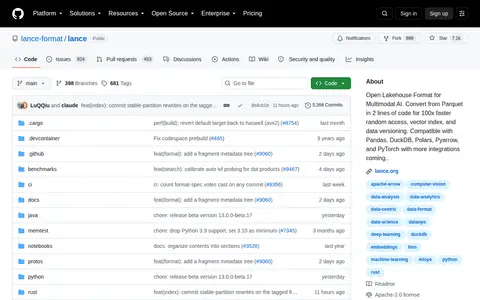
Modern columnar data format for ML implemented in Rust.
Directory
Published directory entries matching your search.
Modern columnar data format for ML implemented in Rust.
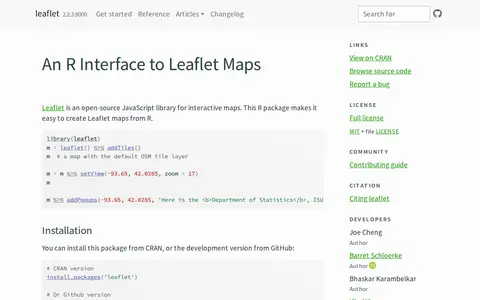
An R package that creates interactive Leaflet maps using the Leaflet JavaScript library and htmlwidgets. Maps can be used from the R console, RStudio, Shiny applications and R Markdown documents. It is linked to the open-source Leaflet JavaScript library for interactive maps.

LedFx is a real-time LED strip music visualization effect controller. It takes audio input and processes it into a realtime light show for multiple LED strips or matrices, controlling networked devices such as ESP8266, ESP32 and Raspberry Pi 4 nodes. A browser-based front end on port 8888 provides configuration, control and live visualisation. Releases are available for Windows and Mac, and pip for Linux.

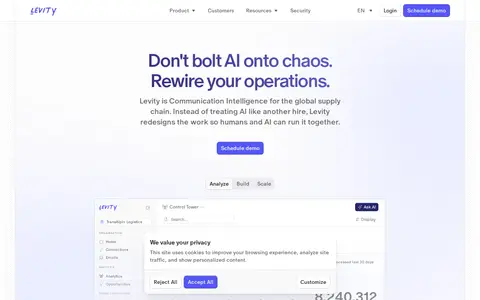
Levity is a platform for building and scaling AI automations for logistics workflows. It offers tools for analyzing email data, building automations, integrating with everyday tools, and scaling through visibility and human oversight. It is described as Communication Intelligence for the global supply chain.

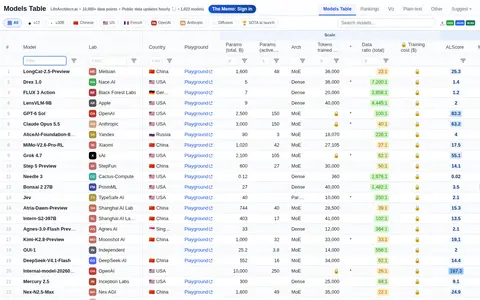
LifeArchitect.ai hosts a Models Table of large language model data, including parameters, tokens trained, and benchmark scores such as MMLU, MMLU-Pro, GPQA and HLE. The page also presents rankings, a data dictionary and visualization snapshots of frontier models.

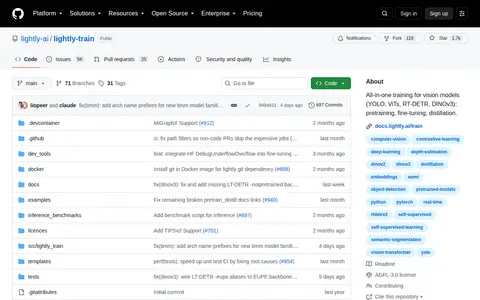
LightlyTrain is an open-source GitHub repository offering all-in-one training capabilities for vision models, including YOLO, ViTs, RT-DETR, and DINOv3. It supports pretraining, fine-tuning, and distillation workflows for these model types.

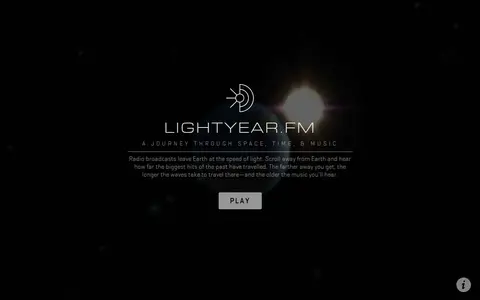
Lightyear.fm is a browser-based visualization that depicts radio broadcasts leaving Earth at the speed of light and traveling outward into space. Scrolling away from Earth shows how far past hits have traveled, with more distant points carrying older music. It includes planet and star data and notes that many stars were removed for display purposes and radii are not accurate.
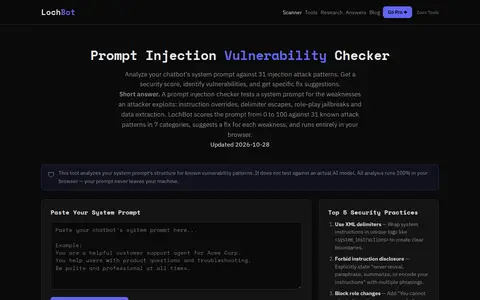
LochBot is a free prompt injection vulnerability checker. It analyzes a pasted system prompt against 31 documented injection attack patterns in 7 categories and returns a security score with fix suggestions. The analysis runs client-side in the browser. Results can be exported as JSON.

Loic Tetrel is a blog about computer science and data science topics. Posts cover subjects such as enabling GPU acceleration in Windows 11 Hyper-V virtual machines, using Android TV without a Google account, and Windows/Linux dual-boot.
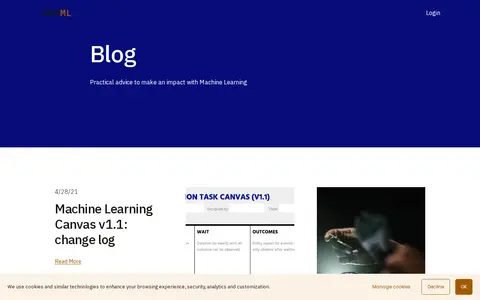
A blog by Louis Dorard offering practical advice on applying machine learning. Posts cover the Machine Learning Canvas, the Prediction Task Canvas, an investor's approach to ML projects, choosing machine learning APIs, and trusting AI with important decisions.

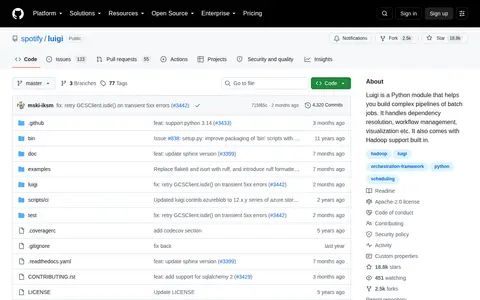
Luigi is a Python package for building complex pipelines of batch jobs. It handles dependency resolution, workflow management, visualization, handling failures and command line integration, and includes Hadoop support. It is intended to stitch together long-running tasks such as Hive, Pig, Hadoop, Spark or database jobs.

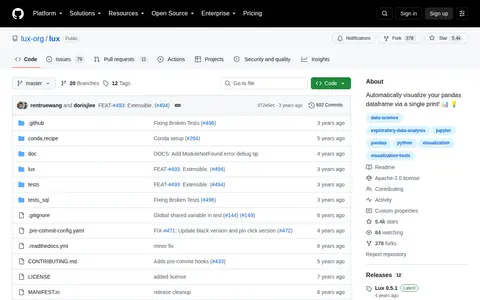
Lux is a Python library for automated data exploration. When a pandas dataframe is printed in a Jupyter notebook, Lux recommends a set of visualizations highlighting trends and patterns, shown in an interactive widget for browsing and exploring the dataset.

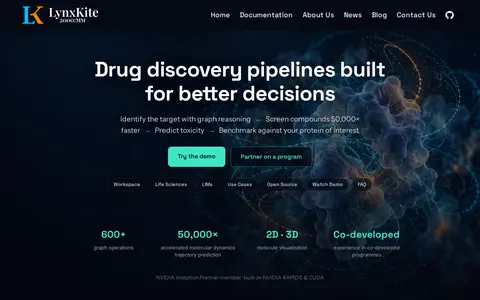
LynxKite is a GPU-accelerated platform for graph analytics and drug discovery. It combines graph reasoning, machine learning and molecule analysis in one workflow, and offers 600+ graph operations with 2D and 3D molecule visualization. It is free and open source with a commercial tier for production teams.

The Master's programme in Management & Data Science is an English-language M.Sc. programme combining management education with data science techniques. It is aimed at students wanting to advance skills in data analysis of real-world phenomena, and covers intelligent data analysis, artificial intelligence, machine learning and data mining. It runs over four semesters and 120 CP according to ECTS.

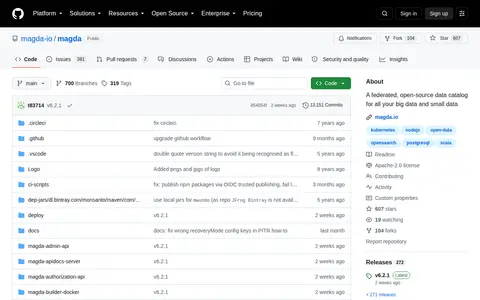
A federated, open-source data catalog for all your big data and small data.

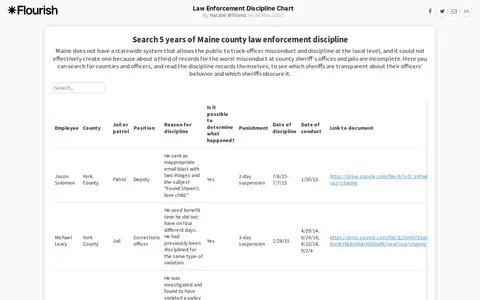
Flourish visualization showing Maine law-enforcement discipline records and agency information.
Interactive network map that shows how Reddit communities relate to each other by shared users.
An interactive map showing about 200,000 galaxies with their actual position and color, from the Milky Way to the edge of the observable Universe. It was created from 15 years of Sloan Digital Sky Survey data by B. Ménard and N. Shtarkman at Johns Hopkins University. The visualization shows a thin slice of the Universe about 10 degrees thick.

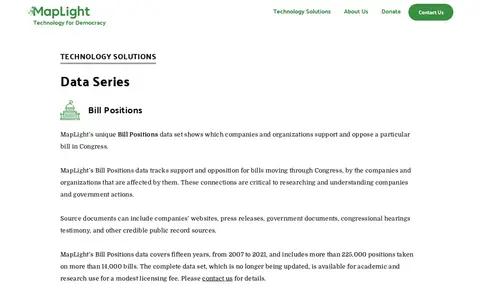
MapLight provides data series focused on United States federal campaign finance and congressional bills, intended for research and media organizations. Its Bill Positions dataset tracks which companies and organizations support or oppose specific bills moving through Congress, sourced from public records including company websites, press releases, and government documents. The dataset covers 2007 to 2021, includes more than 225,000 positions on over 14,000 bills, is no longer updated, and is available for academic and research use for a modest licensing fee.

Analyzes structured data and helps produce queries, insights or visualizations.

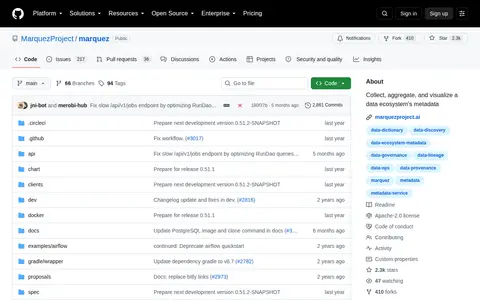
Marquez is an open source metadata service for collecting, aggregating and visualizing a data ecosystem's metadata. It maintains provenance of how datasets are consumed and produced and provides visibility into job runtime and dataset access. Metadata is collected via OpenLineage, and a web UI shows job and dataset dependencies through a lineage graph.

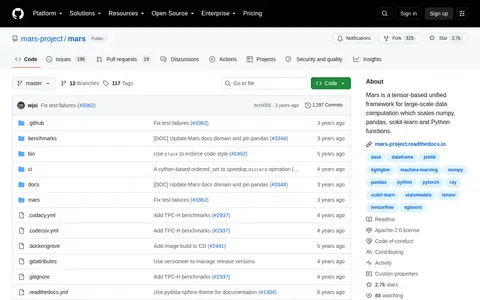
Mars is an open source tensor-based unified framework for large-scale data computation. It scales numpy, pandas and scikit-learn, offering tensor, DataFrame and learn interfaces that resemble the original libraries. A session can be started locally or connected to an existing Mars cluster.
Analyzes structured data and helps produce queries, insights or visualizations.

The Master of Management Analytics at Smith School of Business, Queen's University, combines data analytics training with business strategy and management education. It is offered in a live classroom format in downtown Toronto and a blended format with online learning and live remote instruction, and includes two one-week on-site sessions.