The Data Visualisation Catalogue is a project by Severino Ribecca that provides a non-code-based library of information visualization types. The site serves as a learning and inspiration resource, offering a searchable guide to chart methods such as bar charts, heatmaps and treemaps. Example images mostly use dummy data.
Directory
Search results
Published directory entries matching your search.
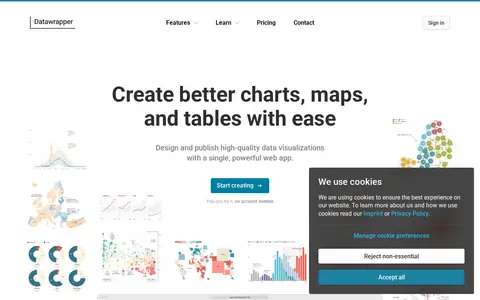
Datawrapper is an online tool for creating interactive charts, maps, and tables without code. It offers more than 20 chart types, over 4,000 basemaps for maps, and configurable tables. Visualizations are responsive and can be embedded on websites or exported to PowerPoint, PNG, PDF, and SVG. A step-based editor, custom themes, and real-time collaboration support design and publishing.
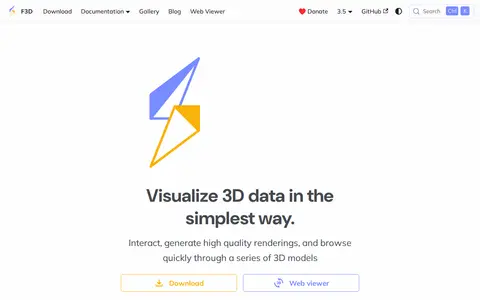
F3D is a fast, minimalist 3D viewer desktop application that is free to use, open source and cross-platform. It visualizes 3D data, with features including realistic rendering, animations, CAD designs, Gaussian splatting, volume rendering and scientific visualization. F3D was originally created by Kitware SAS and relies on open-source projects including VTK, OCCT and Assimp.
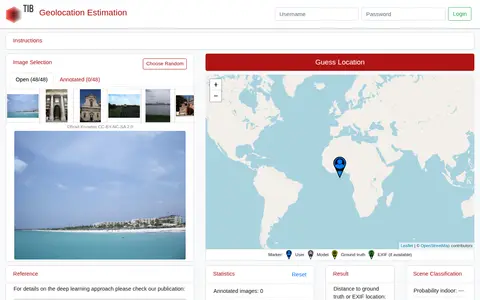
GeoEstimation is a tool for estimating the geolocation of photos. Users select an image from a predefined benchmark test set and click a world map to make a guess. Results are shown as a heat map of likely locations and a visualization of contributing photo parts, alongside scene classification probabilities for indoor, nature and urban settings.
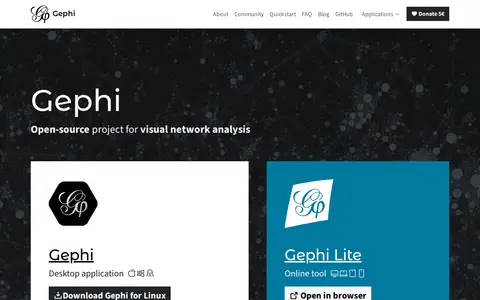
Gephi is free, open-source software for network visualization and analysis. It is available as a desktop application and as Gephi Lite in the browser. It includes algorithms for community detection, centrality measures and clustering, multiple layout algorithms, appearance customization and image exports. The source code is released under the GPL license.
OpenShot is a free, open-source video editor for Linux, Mac, and Windows. It provides color grading and scopes, video effects, keyframe animation, timeline editing, transitions and wipes, interactive video masks, audio visualizations, and 2D and 3D titles. The project is written with Python and PyQt5, uses a C++ backend built on FFmpeg, and is distributed under the GNU General Public License.
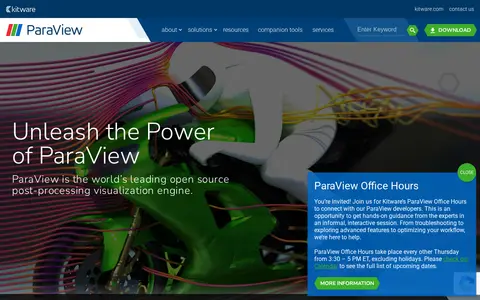
ParaView is an open-source, multi-platform data analysis and visualization application built to analyze extremely large datasets using distributed memory computing resources. It runs on Linux, macOS and Windows, from laptops to supercomputers, and includes readers for many file formats and more than 200 filters. It can also run in situ using ParaView Catalyst and in a web browser using trame.
Real-time visualization tool for architecture, product scenes, landscapes, and 3D presentations.
Real-time 3D engine for games, animation, virtual production, visualization, and interactive media.