


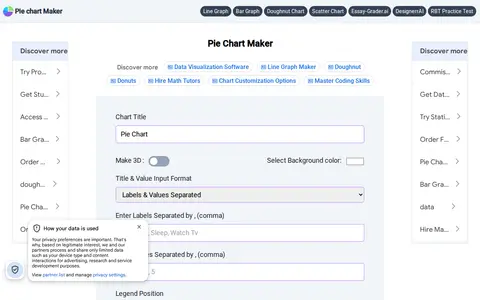
Pie Chart Maker is a free online tool for creating pie charts. Users enter labels and values, and can configure options such as background color, legend position, pie hole for a doughnut chart, 3D display and slice text. Charts can be downloaded as jpg, png or svg files.
ParaView
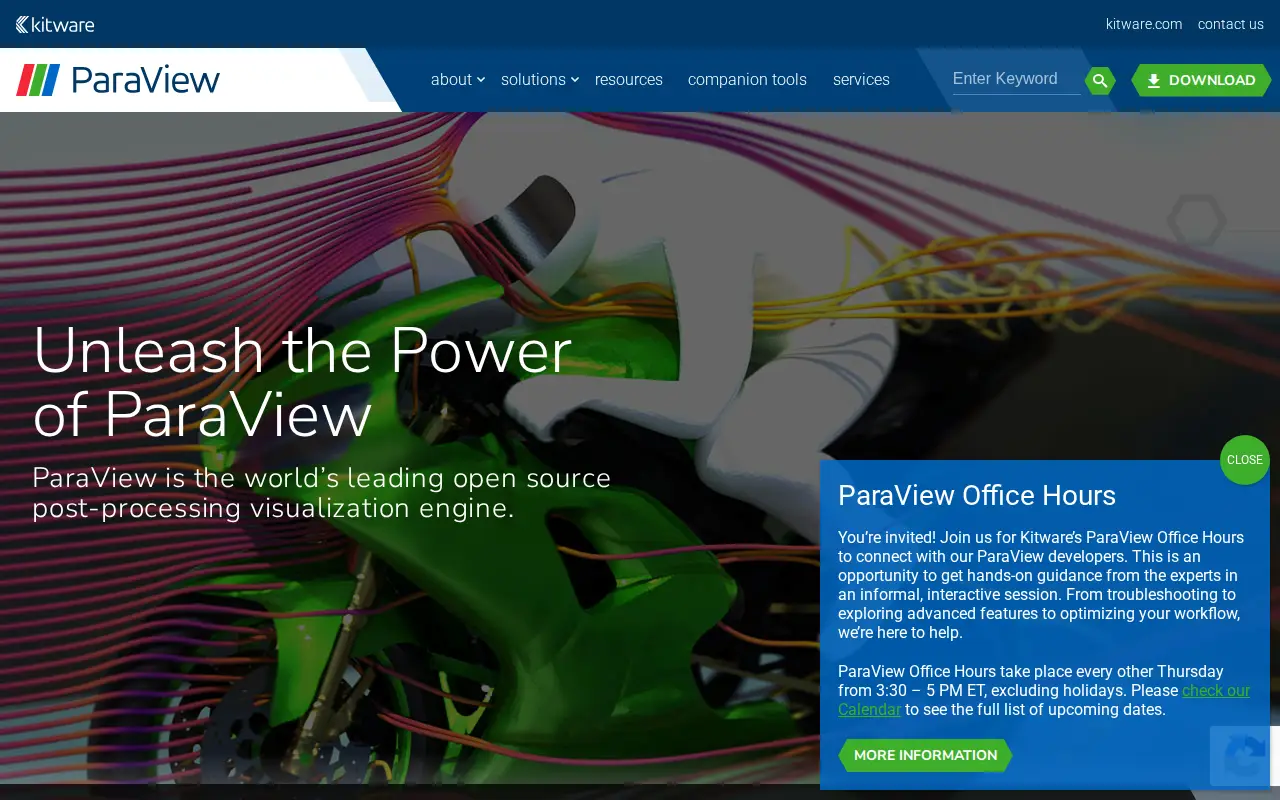
ParaView is an open-source, multi-platform data analysis and visualization application built to analyze extremely large datasets using distributed memory computing resources. It runs on Linux, macOS and Windows, from laptops to supercomputers, and includes readers for many file formats and more than 200 filters. It can also run in situ using ParaView Catalyst and in a web browser using trame.
Features
- ParaView includes more than 200 filters Source: www.paraview.org
Links
Tags
-
0Pie Chart Maker is a free online tool for creating pie charts. Users enter labels and values, and can configure options such as background color, legend position, pie hole for a doughnut chart, 3D display and slice text. Charts can be downloaded as jpg, png or svg files.
-
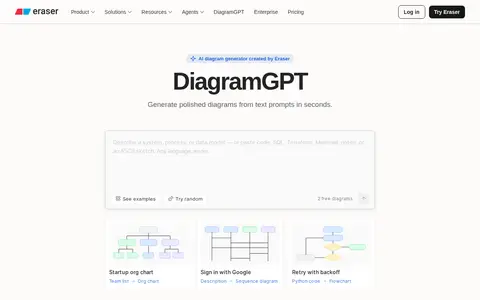
0DiagramGPT is an AI diagram generator created by Eraser that generates diagrams from text prompts. Five diagram types are available: flow charts, entity relationship diagrams, cloud architecture diagrams, sequence diagrams and BPMN diagrams. Generated diagrams can be edited in Eraser. An API is available only to Starter, Business and Enterprise Plan teams.
-
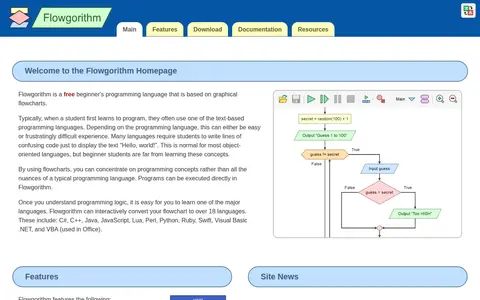
0Flowgorithm is a free beginner's programming language based on graphical flowcharts. Programs can be executed in Flowgorithm, which can interactively convert flowcharts to over 18 languages including C#, C++, Java, JavaScript, Python and Swift. It features a graphical variable watch window, loops, arrays and multilingual support.
-
0Charts Builder is an online service for working with the Google Charts API. The Google Chart API lets users dynamically generate charts, and the service allows updating input data and changing the style of a chart preview.
-
0
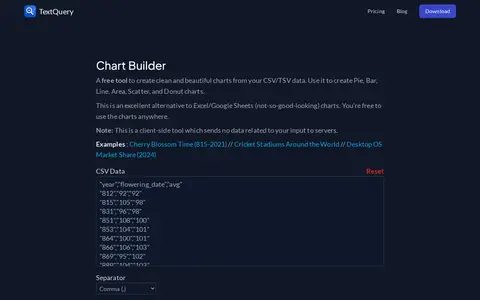
Chart Builder is a free client-side tool for creating pie, bar, line, area, scatter and donut charts from CSV or TSV data. It sends no data related to input to servers, and the charts can be used anywhere.
-
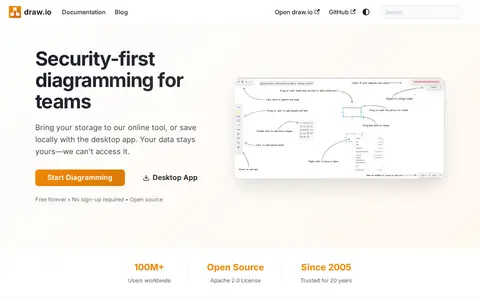
0draw.io is a free diagramming application for drawing technical diagrams and web-based sketching. Diagrams can be stored in online storage platforms, a browser, a local device, or offline with a standalone desktop app. It integrates with platforms including Atlassian Confluence and Jira, Google applications, GitHub, GitLab, Microsoft applications and Notion.
Community notes
Reviews and discussion
No reviews yet
Be the first to share how this project worked for you.
Join the discussion
Sign in with a verified account to leave a review or join the discussion.
Sign in to review