textquery.app
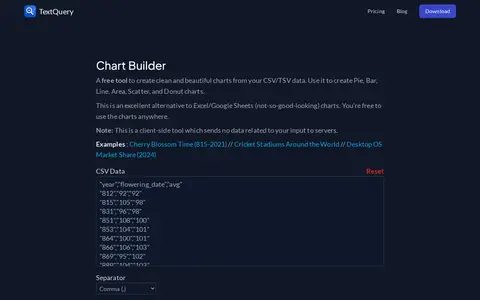
Chart Builder is a free client-side tool for creating pie, bar, line, area, scatter and donut charts from CSV or TSV data. It sends no data related to input to servers, and the charts can be used anywhere.

The Data Visualisation Catalogue is a project by Severino Ribecca that provides a non-code-based library of information visualization types. The site serves as a learning and inspiration resource, offering a searchable guide to chart methods such as bar charts, heatmaps and treemaps. Example images mostly use dummy data.
Chart Builder is a free client-side tool for creating pie, bar, line, area, scatter and donut charts from CSV or TSV data. It sends no data related to input to servers, and the charts can be used anywhere.

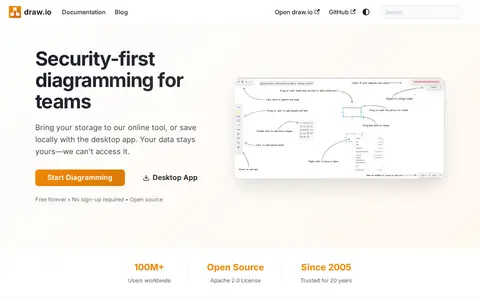
draw.io is a free diagramming application for drawing technical diagrams and web-based sketching. Diagrams can be stored in online storage platforms, a browser, a local device, or offline with a standalone desktop app. It integrates with platforms including Atlassian Confluence and Jira, Google applications, GitHub, GitLab, Microsoft applications and Notion.

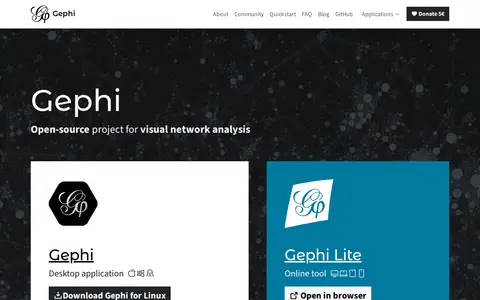
Gephi is free, open-source software for network visualization and analysis. It is available as a desktop application and as Gephi Lite in the browser. It includes algorithms for community detection, centrality measures and clustering, multiple layout algorithms, appearance customization and image exports. The source code is released under the GPL license.

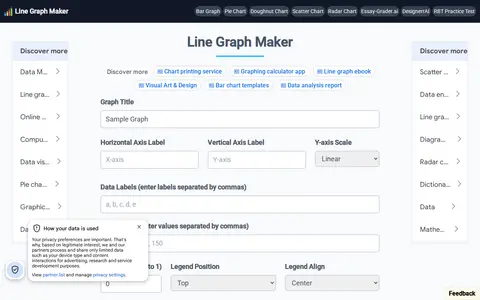
LineGraphMaker is an online tool for creating line graphs. Users add a title and axis labels, enter data labels and values separated by commas, adjust line tension, set axis scale and grid lines, and download the graph as a JPG or PNG file.
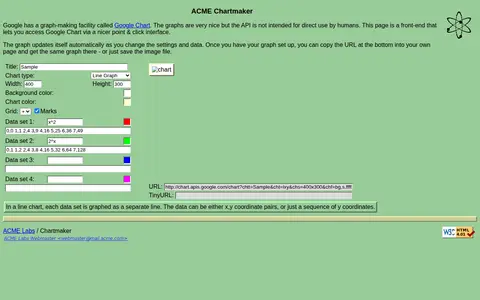
A front-end that provides a point-and-click interface for accessing Google Chart, intended because the Chart API is not meant for direct human use. The graph updates automatically as settings and data change, and users can copy the URL into their own page or save the image file.
PlantText is a storage, design, or frontend resource for mockups, assets, UI tools, or web search.
Community notes
Be the first to share how this project worked for you.
Sign in with a verified account to leave a review or join the discussion.
Sign in to reviewKeep exploring
Chart Builder is a free client-side tool for creating pie, bar, line, area, scatter and donut charts from CSV or TSV data. It sends no data related to input to servers, and the charts can be used anywhere.
draw.io is a free diagramming application for drawing technical diagrams and web-based sketching. Diagrams can be stored in online storage platforms, a browser, a local device, or offline with a standalone desktop app. It integrates with platforms including Atlassian Confluence and Jira, Google applications, GitHub, GitLab, Microsoft applications and Notion.
Gephi is free, open-source software for network visualization and analysis. It is available as a desktop application and as Gephi Lite in the browser. It includes algorithms for community detection, centrality measures and clustering, multiple layout algorithms, appearance customization and image exports. The source code is released under the GPL license.
LineGraphMaker is an online tool for creating line graphs. Users add a title and axis labels, enter data labels and values separated by commas, adjust line tension, set axis scale and grid lines, and download the graph as a JPG or PNG file.
A front-end that provides a point-and-click interface for accessing Google Chart, intended because the Chart API is not meant for direct human use. The graph updates automatically as settings and data change, and users can copy the URL into their own page or save the image file.
PlantText is a storage, design, or frontend resource for mockups, assets, UI tools, or web search.