Directory

Search results

Published directory entries matching your search.

Search results

26 listings
rstudio.github.io

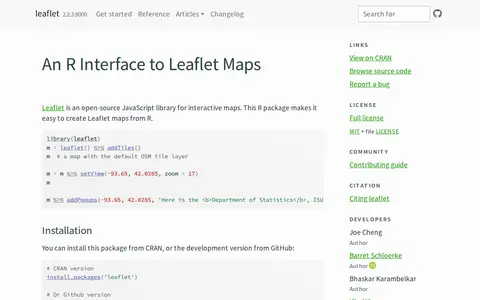
An R package that creates interactive Leaflet maps using the Leaflet JavaScript library and htmlwidgets. Maps can be used from the R console, RStudio, Shiny applications and R Markdown documents. It is linked to the open-source Leaflet JavaScript library for interactive maps.

AI Data & Analytics 0
d3js.org

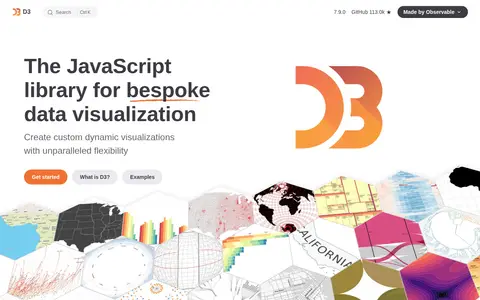
D3.js is a JavaScript library for bespoke data visualization developed by Observable. It enables creation of custom dynamic visualizations with features including selections and transitions, scales and axes, shape rendering, interactive behaviors, layout algorithms, and geographic map projections. The library also powers Observable Plot, a high-level visualization API.

AI Data & Analytics 0
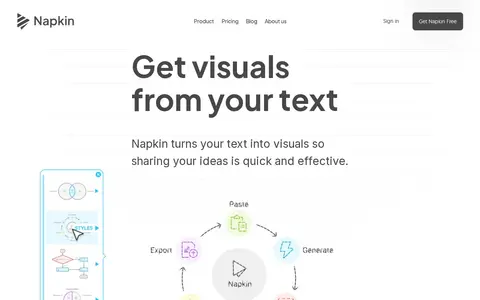
napkin.ai

Napkin AI is a tool that turns pasted text into visuals such as flowcharts, mind maps, infographics, diagrams, data charts and slides, without design skills. Users generate visuals from their text, then adjust colors and elements. Visuals can be exported as .ppt, .png, .pdf or .svg. A free plan offers 500 AI credits per week, and pricing lists Plus at $9 per person per month.

Models & Machine Learning 0
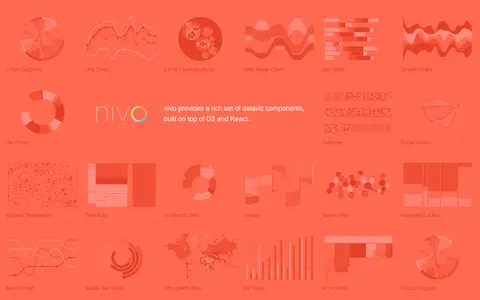
nivo.rocks

Nivo is a library of React data visualization components built on top of D3 and React. It provides a range of dataviz components including chord diagrams, line charts, bar charts, pie charts, choropleth maps and other visualization types.

AI Data & Analytics 0
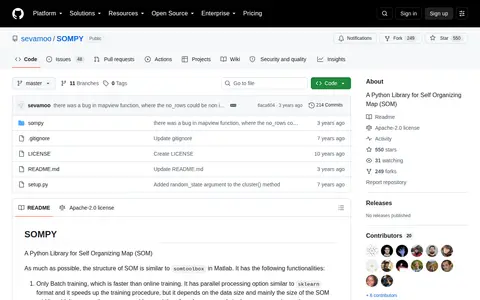
github.com

SOMPY is a Python library for self-organizing maps structured similarly to somtoolbox in Matlab. It offers only batch training, PCA or RandomPCA initialization, component plane visualization, hitmap and U-Matrix visualization, and 1-d or 2-d SOM with rectangular, planar grid. It supports function approximation and predictions, mostly using Sklearn.

AI Data & Analytics 0
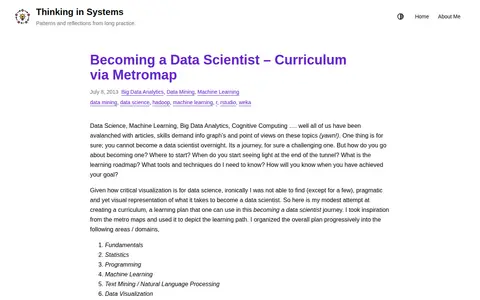
nirvacana.com

A blog post presenting a learning curriculum for becoming a data scientist, visualized as a metro map. The overall plan is organized progressively into areas or domains, each represented as a metro line with stations depicting topics.

AI Education & Learning 0
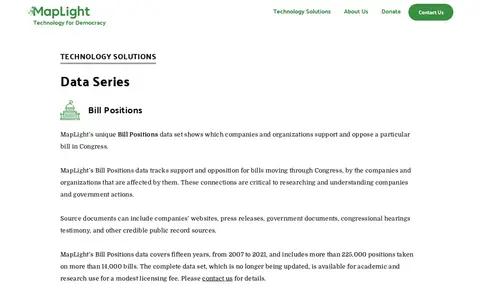
maplight.org

MapLight provides data series focused on United States federal campaign finance and congressional bills, intended for research and media organizations. Its Bill Positions dataset tracks which companies and organizations support or oppose specific bills moving through Congress, sourced from public records including company websites, press releases, and government documents. The dataset covers 2007 to 2021, includes more than 225,000 positions on over 14,000 bills, is no longer updated, and is available for academic and research use for a modest licensing fee.

AI Data & Analytics 0
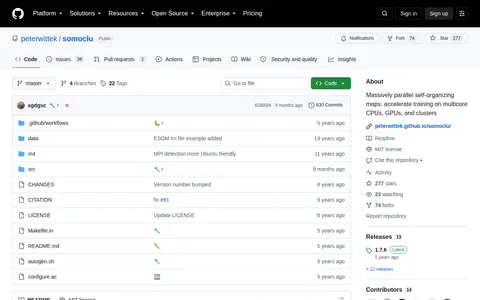
github.com

Somoclu is a massively parallel implementation of self-organizing maps, using multicore CPUs, MPI for cluster workload distribution, and CUDA acceleration. It supports OpenMP, MPI, and CUDA, runs on Linux, macOS, and Windows, and offers planar and toroid maps, rectangular and hexagonal grids, and Gaussian and bubble neighborhood functions. Both dense and sparse input data are supported, with interfaces for Python, R, Julia, and MATLAB.

AI Data & Analytics 0
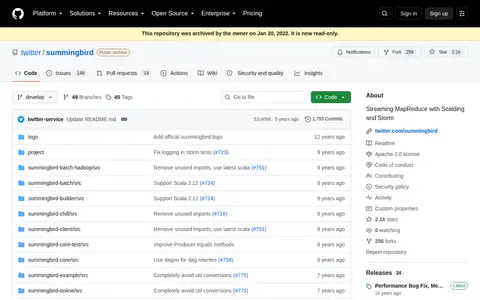
github.com

Summingbird is a library for writing MapReduce programs that resemble native Scala or Java collection transformations and running them on distributed MapReduce platforms including Storm and Scalding. Programs can execute in batch mode, realtime mode, or a hybrid mode combining Scalding and Storm. The repository was archived by its owner on Jan 20, 2022 and is read-only.

AI Data & Analytics 0
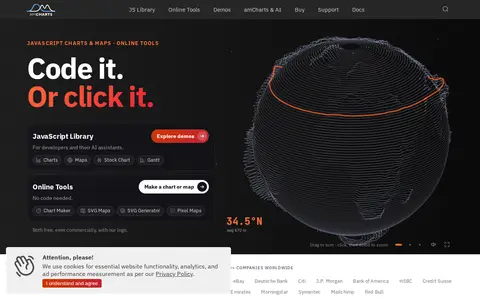
amcharts.com

amCharts is a TypeScript library for JavaScript charts, offering 60+ chart types plus maps, stock charts, and Gantt charts. The site states the library is free to use and React-ready. Documentation lists React, Angular, Vue.js, Next.js, and other integrations.

AI Data & Analytics 0
anychart.com

AnyChart is a JavaScript charting library with an API and documentation. It offers a large number of chart types, and the site lists related products for stock charts, HTML5 maps and Gantt charts. Version 9.0.0 added chart types including arc diagram, dependency wheel, org chart, stream graph, waffle chart, lollipop and dumbbell. The library is described as working with any development stack.

AI Data & Analytics 0
cartodb.github.io

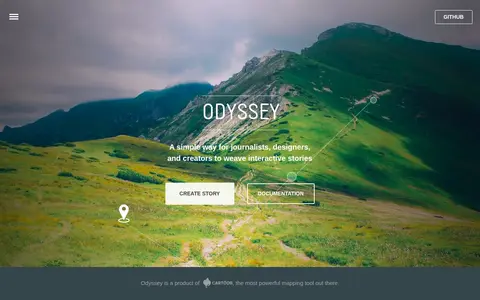
Odyssey.js is an open source tool that combines maps, narratives and other multimedia into stories. It offers templates including scrolling, slide based and temporal designs, and Actions for map movements and content display. The sandbox lets users test the library and edit story content with Markdown. It is an early-stage project developed by cartodb.com with Knight Foundation funding.

AI Data & Analytics 0
scitools.org.uk

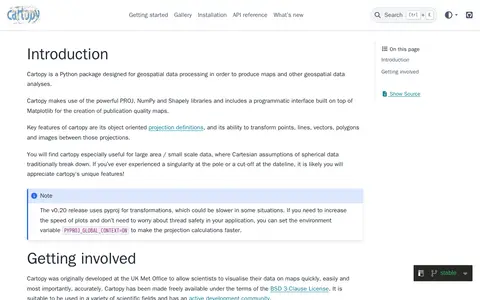
Cartopy is a Python package designed for geospatial data processing in order to produce maps and other geospatial data analyses.

AI Data & Analytics 0
github.com

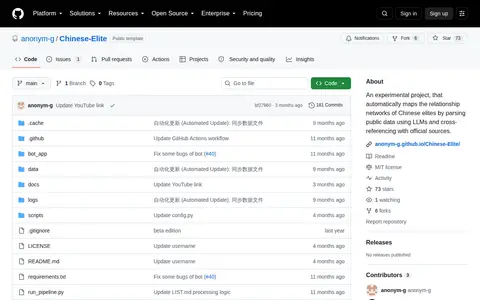
Project that automatically maps relationship networks by parsing public data using LLMs and visualizes it as an interactive graph.

Models & Machine Learning 0
count.co

Count is a collaborative platform for AI-powered analytics and research that requires explanations for AI-generated answers. Users work with data, files and tools to build canvases containing maps, charts and reports, with comments and tagging for teammates. A free tier includes one project, three canvases, up to five users and daily AI credit limits; the Pro plan costs $49 per editor per month with viewers free.

AI Data & Analytics 0
crimebrasil.com.br

Mapa do crime no Brasil com dados oficiais de polĂ­cia, DataSUS e CNJ. Busque sua cidade ou bairro e veja estatĂ­sticas por 100 mil habitantes.

AI Data & Analytics 0
datamaps.github.io

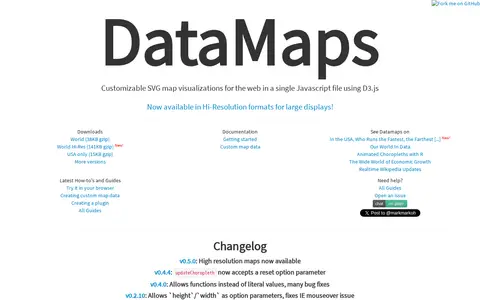
DataMaps is a jQuery plugin for geographical map data visualizations using d3.js and SVG. The page lists changelog entries, including high resolution maps in v0.5.0 and a reset option parameter for updateChoropleth in v0.4.4.

AI Data & Analytics 0
simile-widgets.org

Exhibit is an open source publishing framework for creating data-rich interactive web pages. It provides advanced text search and filtering, along with interactive maps, timelines and other visualizations. The software is licensed under the BSD license and was originally sponsored partially by The Andrew W. Mellon Foundation as part of the SIMILE project.

AI Data & Analytics 0
ggplot2.tidyverse.org

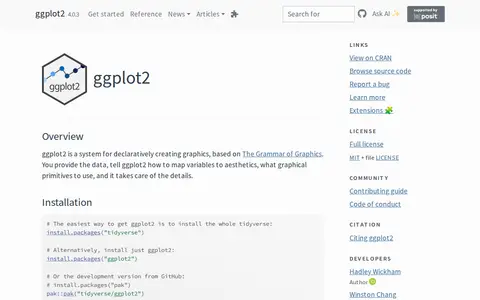
ggplot2 is a system for declaratively creating graphics, based on The Grammar of Graphics. Users provide the data and specify how variables map to aesthetics and which graphical primitives to use, and the system handles the details. It is described as over 10 years old, and installation is available through the tidyverse or as a standalone package.

AI Data & Analytics 0
highcharts.com

High Charts is a JavaScript charting library designed for use in web applications, dashboards, grids and frameworks including React. It offers products for core charting, stock data, maps, Gantt charts, grids and dashboards, and is used by a large number of global enterprises. The library provides built-in adaptive functionality and extensive customization options for interactive data visualizations.

AI Data & Analytics 0
htmlwidgets.org

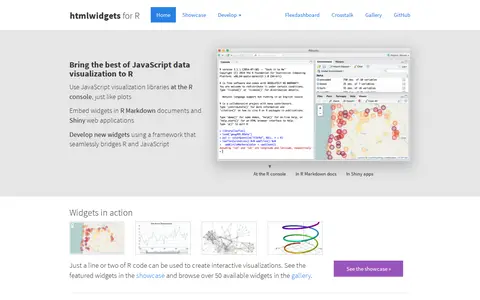
HTML widgets are R packages that produce interactive web visualizations, working like R plots. A line or two of R code produces a D3 graphic or Leaflet map. Widgets run at the R console and can be embedded in R Markdown reports and Shiny web applications. The page lists widget examples including Leaflet, dygraphs, Plotly and Highcharter, and describes composing dashboards with flexdashboard and linking widgets with crosstalk. New widgets can be developed by bridging R and JavaScript.

AI Data & Analytics 0
japanneighborhoods.com

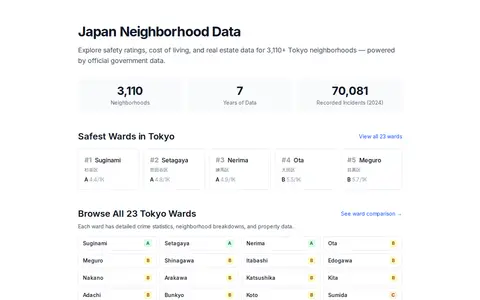
Japan Neighborhoods provides data-driven neighborhood guides for Japan. It offers crime statistics, safety scores, demographic data, cost of living, and real estate information for over 5,000 Tokyo neighborhoods. The data is sourced from official government sources and presented through safety rankings, interactive maps, and property listings.

AI Data & Analytics 0
github.com

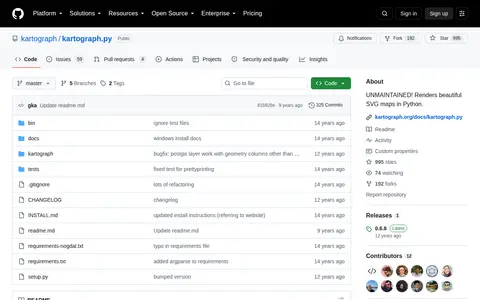
Kartograph.py is a Python library for rendering beautiful SVG maps. The project is currently unmaintained, but its source code remains available on GitHub. It allows users to create map visualizations programmatically.

AI Data & Analytics 0
movebank.org

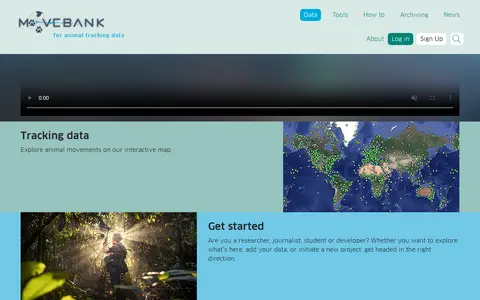
Movebank is a free online database of animal tracking data hosted by the Max Planck Institute of Animal Behavior. It helps animal tracking researchers manage, share, protect, analyze and archive their data, and offers an interactive map for exploring animal movements.
AI Data & Analytics 0