



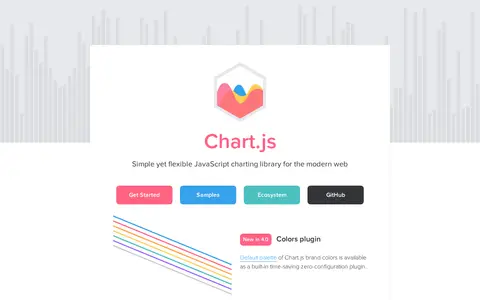
Chart.js is an open source JavaScript charting library for the modern web, described as simple yet flexible. It supports eight animated and customisable chart types and renders on HTML5 Canvas across modern browsers, redrawing charts on window resize. Version 4.0 added a colors plugin and tree-shaking to reduce bundle size.
AnyChart
AnyChart is a JavaScript charting library with an API and documentation. It offers a large number of chart types, and the site lists related products for stock charts, HTML5 maps and Gantt charts. Version 9.0.0 added chart types including arc diagram, dependency wheel, org chart, stream graph, waffle chart, lollipop and dumbbell. The library is described as working with any development stack.
Features
- lightweight and robust JavaScript charting library Source: www.anychart.com
- the library works easily with any development stack Source: www.anychart.com
Links
Tags
-
0Chart.js is an open source JavaScript charting library for the modern web, described as simple yet flexible. It supports eight animated and customisable chart types and renders on HTML5 Canvas across modern browsers, redrawing charts on window resize. Version 4.0 added a colors plugin and tree-shaking to reduce bundle size.
-
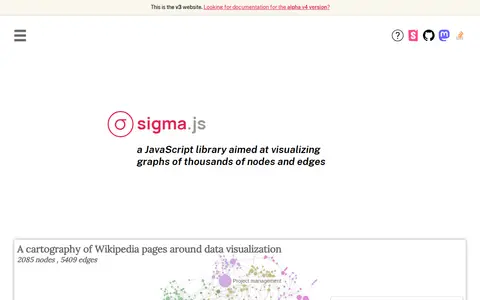
0Sigma.js is a WebGL-powered JavaScript library for interactive graph visualization, built on graphology. It provides GPU-accelerated rendering, built-in pan, zoom, hover and multi-touch interactions, and works with React, Angular, Vue or vanilla JavaScript. Layouts, metrics and community detection come via graphology's standard library.
-
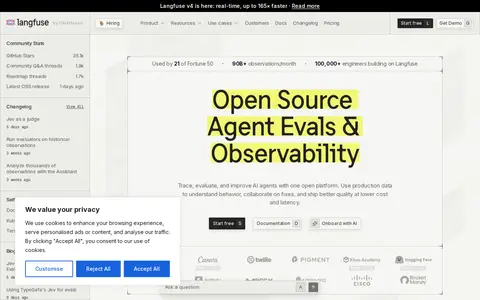
0Langfuse is an open source platform for tracing, evaluating and improving AI agents. It connects tracing, monitoring, datasets, experiments and evaluation in one continuous loop, capturing every LLM call, tool invocation and retrieval step. The platform includes prompt management, a playground, experiments and human annotation, and works with any language or framework supporting OpenTelemetry instrumentation.
-
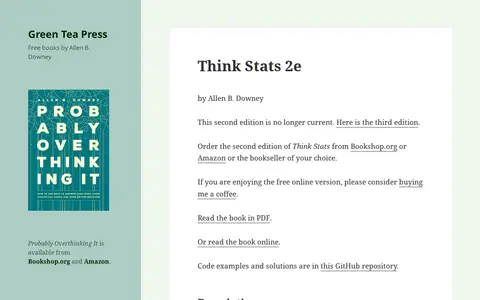
0Think Stats is an introduction to probability and statistics for Python programmers, emphasizing simple techniques for exploring real data sets and answering questions. It includes case studies using datasets from the National Institutes of Health and other sources, with exercises using short programs. The second edition is no longer current and is available under a Creative Commons license.
-
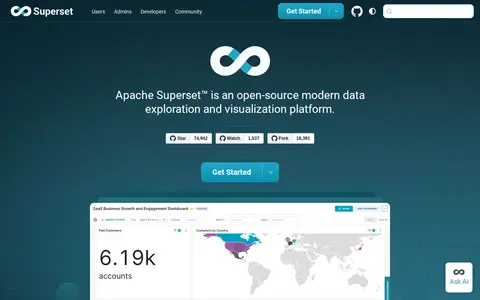
0Apache Superset is an open-source data exploration and visualization platform. It offers a no-code visualization builder and a SQL IDE, connects to SQL-based databases, and ships with more than 40 pre-installed visualization types. It includes dashboards, a chart builder, SQL Lab and datasets, with a plug-in architecture for custom visualizations.
-
0Loic Tetrel is a blog about computer science and data science topics. Posts cover subjects such as enabling GPU acceleration in Windows 11 Hyper-V virtual machines, using Android TV without a Google account, and Windows/Linux dual-boot.
Community notes
Reviews and discussion
No reviews yet
Be the first to share how this project worked for you.
Join the discussion
Sign in with a verified account to leave a review or join the discussion.
Sign in to review