

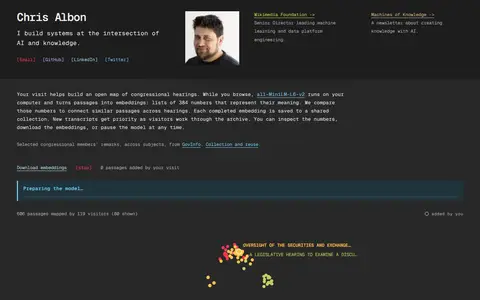
A personal website of Chris Albon. While browsing, the all-MiniLM-L6-v2 model runs on the visitor's computer and turns passages from congressional hearings into 384-number embeddings, which are compared to connect similar passages. Completed embeddings are saved to a shared collection, and visitors can inspect the numbers, download embeddings or pause the model.
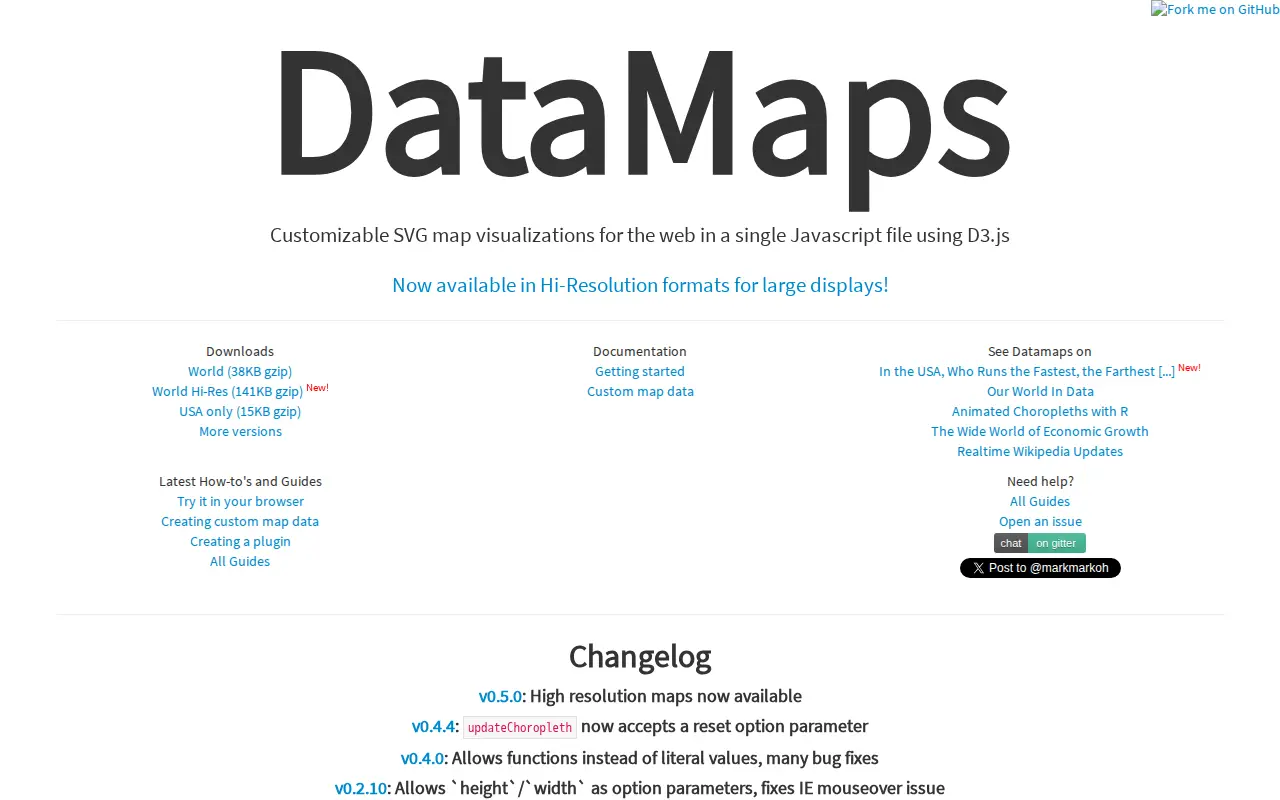
Datamaps
DataMaps is a jQuery plugin for geographical map data visualizations using d3.js and SVG. The page lists changelog entries, including high resolution maps in v0.5.0 and a reset option parameter for updateChoropleth in v0.4.4.
Features
- A jQuery plugin for geographical map data visualizations using d3.js, SVG Source: datamaps.github.io
Links
Tags
-
0
A personal website of Chris Albon. While browsing, the all-MiniLM-L6-v2 model runs on the visitor's computer and turns passages from congressional hearings into 384-number embeddings, which are compared to connect similar passages. Completed embeddings are saved to a shared collection, and visitors can inspect the numbers, download embeddings or pause the model.

-
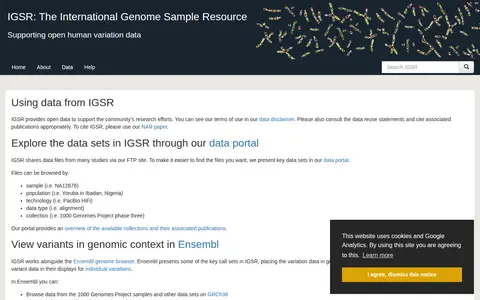
0IGSR, the International Genome Sample Resource, provides open human variation data. Data files from many studies are shared via FTP, with key data sets presented in a data portal browsable by sample, population, technology, data type and collection. Ensembl presents some key call sets in genomic context. Bulk downloads are recommended via Globus, with FTP and Aspera also available.
-
0SciRuby is a project providing tools for scientific computing and data visualization in Ruby. Its releases include NMatrix, a linear algebra library with dense and sparse matrix storage and tensor support, alongside visualization and statistics gems. The project describes itself as currently alpha, and it notes its gems are tested but not battle-hardened. SciRuby and NMatrix are available under the BSD three-clause license.
-
0
The Quiet-Broke Index is a research project modeled by Henry Finance that estimates the high-earner squeeze across 30 US metros at a $400,000 household income. It combines five fixed costs: housing, taxes, childcare, healthcare and transportation. A calculator gives a 0–100 score from five inputs, and the site ranks cities and reports per-line-item decomposition.
-
0
Analyzes structured data and helps produce queries, insights or visualizations.
-
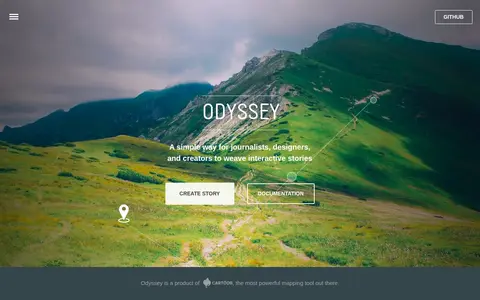
0Odyssey.js is an open source tool that combines maps, narratives and other multimedia into stories. It offers templates including scrolling, slide based and temporal designs, and Actions for map movements and content display. The sandbox lets users test the library and edit story content with Markdown. It is an early-stage project developed by cartodb.com with Knight Foundation funding.
Community notes
Reviews and discussion
No reviews yet
Be the first to share how this project worked for you.
Join the discussion
Sign in with a verified account to leave a review or join the discussion.
Sign in to review