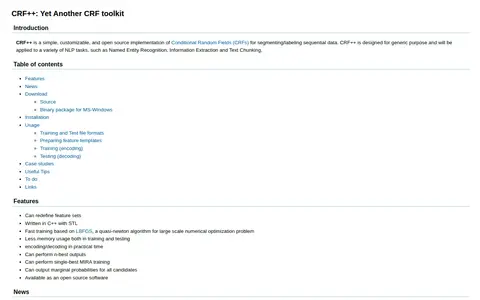
CRF++ is an open source implementation of Conditional Random Fields for segmenting and labeling sequential data. It is designed for general purposes and can be applied to NLP tasks such as named entity recognition, information extraction and text chunking. Feature sets can be redefined, and it is written in C++ with STL.
Directory
Search results
Published directory entries matching your search.
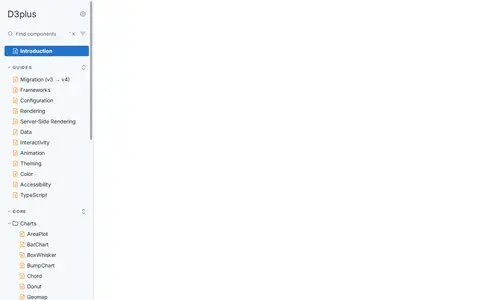
D3.js is a JavaScript library for bespoke data visualization developed by Observable. It enables creation of custom dynamic visualizations with features including selections and transitions, scales and axes, shape rendering, interactive behaviors, layout algorithms, and geographic map projections. The library also powers Observable Plot, a high-level visualization API.
An open-source JavaScript visualization library that streamlines the creation of beautiful and accessible SVG data visualizations.
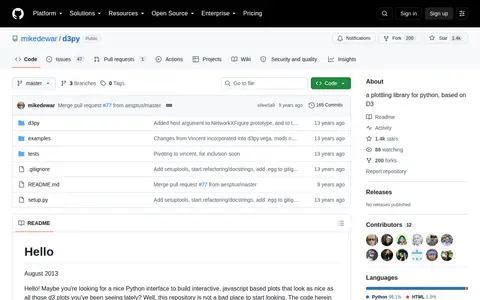
d3py is a plotting library for Python based on D3. It builds on d3.js and the pandas DataFrame module to plot data from the command line or simple scripts into a browser window. Its README describes the code as an experiment, notes that it is not actively developed, and points to vincent as an alternative.
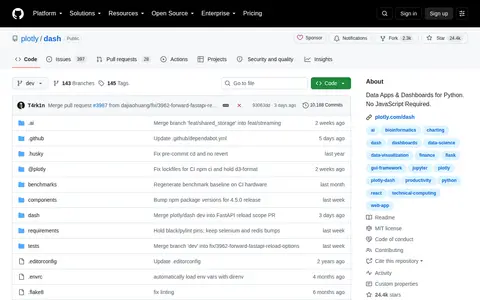
Dash is an open-source Python library for building data applications and dashboards without requiring JavaScript expertise. It is maintained by Plotly and hosted on the company's public GitHub repository, where users can access source code and contribute to the project.
Data Skeptic is a podcast hosted by Kyle Polich, featuring interviews with experts on data science, machine learning, AI, and statistics.
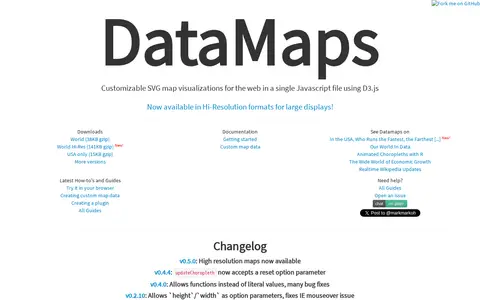
DataMaps is a jQuery plugin for geographical map data visualizations using d3.js and SVG. The page lists changelog entries, including high resolution maps in v0.5.0 and a reset option parameter for updateChoropleth in v0.4.4.
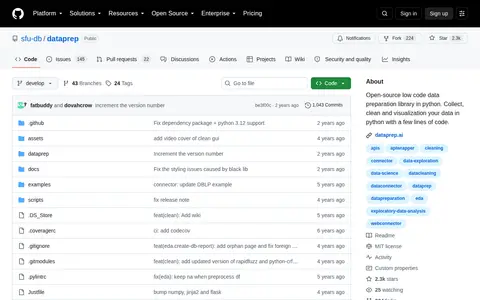
Collect, clean and visualize your data in Python.
Analyzes structured data and helps produce queries, insights or visualizations.
DataTalks.Club - the place to talk about data!
DataTalks.Club is an online community for data science professionals, ML engineers and AI practitioners. It offers free courses, weekly podcasts, webinars, workshops and book discussions, along with articles, a Slack group and a weekly newsletter. Events and podcast episodes cover topics such as machine learning, AI platforms and LLM engineering.
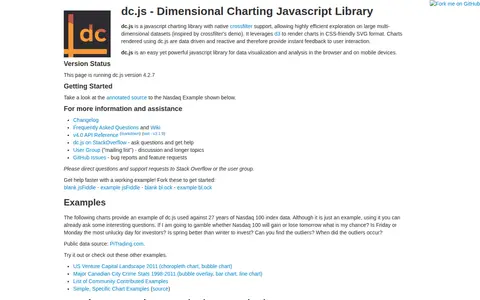
dc.js is a JavaScript charting library with native crossfilter support for exploring large multi-dimensional datasets. It uses d3 to render charts in CSS-friendly SVG format. Charts are data driven and reactive, providing instant feedback to user interaction. The library is described as usable in the browser and on mobile devices.
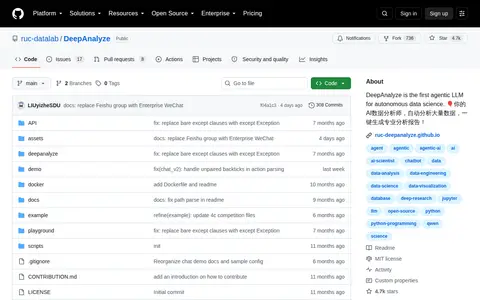
An agentic LLM for autonomous data science that performs data preparation, analysis, modeling, visualization, and report generation without human intervention. It supports open-ended research on structured, semi-structured, and unstructured data sources, and the model, code, training data, and demo are open-sourced.
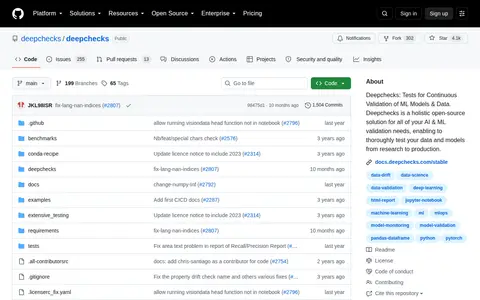
Deepchecks is an open-source project for validating machine learning models and data from research to production. It includes built-in and custom checks and suites for tabular, NLP and CV validation, CI and testing management, and monitoring of deployed models. Installation is via pip.
Library of SAS Enterprise Miner process flow diagrams to help you learn by example about specific data mining topics.
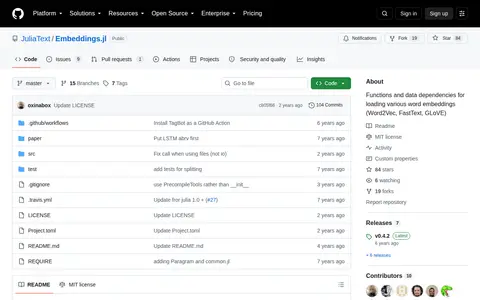
Functions and data dependencies for loading various word embeddings.
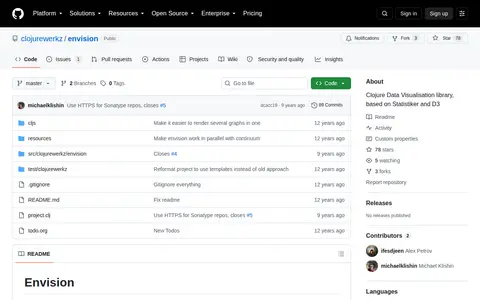
Clojure Data Visualisation library, based on Statistiker and D3.
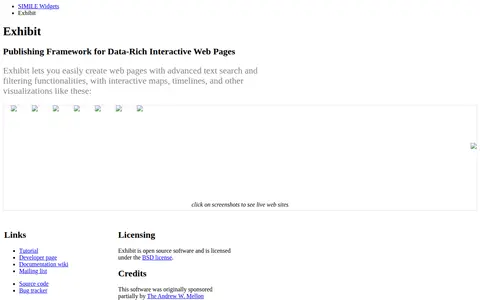
Exhibit is an open source publishing framework for creating data-rich interactive web pages. It provides advanced text search and filtering, along with interactive maps, timelines and other visualizations. The software is licensed under the BSD license and was originally sponsored partially by The Andrew W. Mellon Foundation as part of the SIMILE project.
Analyzes structured data and helps produce queries, insights or visualizations.
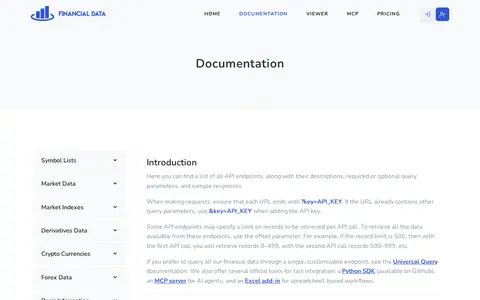
Documentation - Financial Data API.
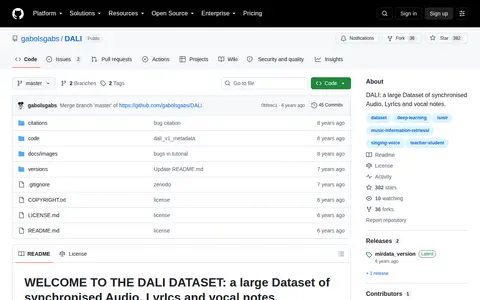
DALI is a dataset of synchronised audio, lyrics and vocal notes, presented as a collection of gz files. A Python package, dali_code, is stored in the repository for reading and working with the data; release versions are installable via pip. The dataset was created automatically using a teacher-student machine learning paradigm, described in an ISMIR 2018 paper.
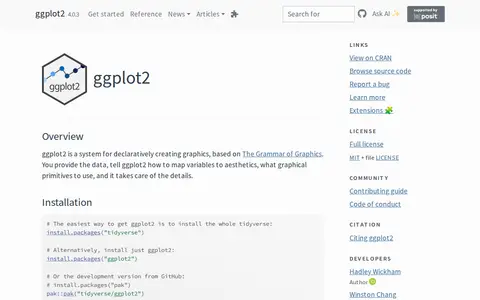
ggplot2 is a system for declaratively creating graphics, based on The Grammar of Graphics. Users provide the data and specify how variables map to aesthetics and which graphical primitives to use, and the system handles the details. It is described as over 10 years old, and installation is available through the tidyverse or as a standalone package.
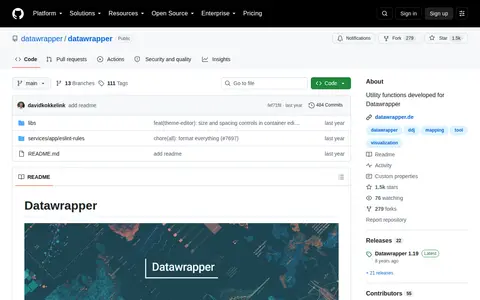
Datawrapper An open source data visualization platform helping everyone to create simple, correct and embeddable charts. Also at.
The mat package from Gonum provides implementations of float64 and complex128 matrix structures and linear algebra operations on them in Go. It offers interfaces for matrix classes, concrete implementations such as Dense and SymDense, methods for using matrix data, and types for matrix factorizations such as QR and LU.