


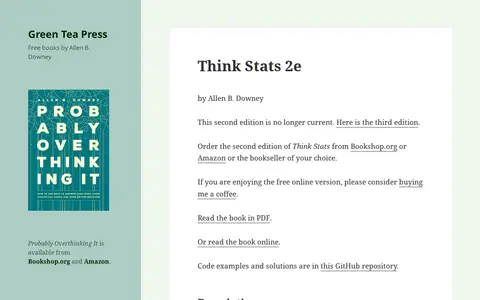

Think Stats is an introduction to probability and statistics for Python programmers, emphasizing simple techniques for exploring real data sets and answering questions. It includes case studies using datasets from the National Institutes of Health and other sources, with exercises using short programs. The second edition is no longer current and is available under a Creative Commons license.
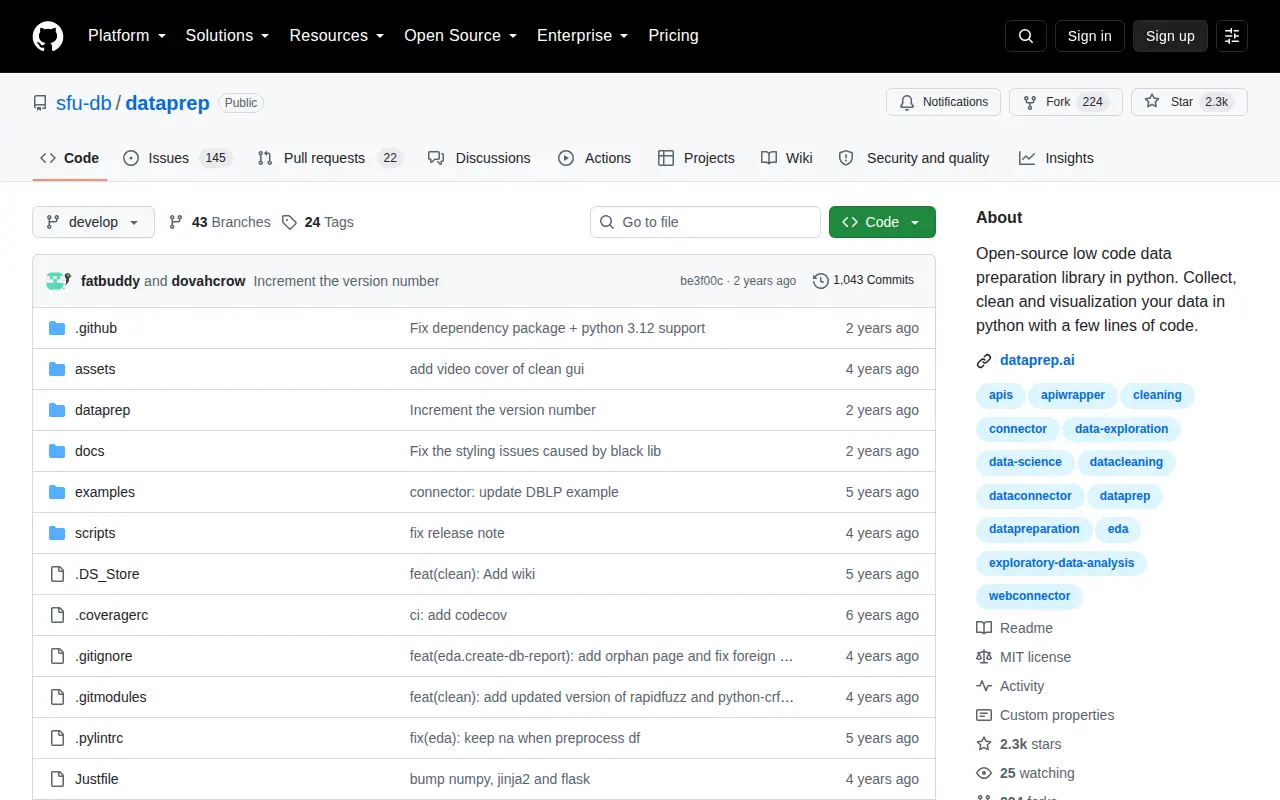
DataPrep
Collect, clean and visualize your data in Python.
Links
Tags
-
0Think Stats is an introduction to probability and statistics for Python programmers, emphasizing simple techniques for exploring real data sets and answering questions. It includes case studies using datasets from the National Institutes of Health and other sources, with exercises using short programs. The second edition is no longer current and is available under a Creative Commons license.
-
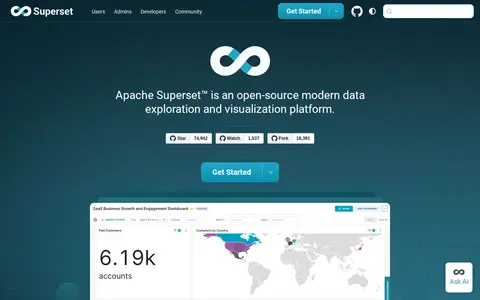
0Apache Superset is an open-source data exploration and visualization platform. It offers a no-code visualization builder and a SQL IDE, connects to SQL-based databases, and ships with more than 40 pre-installed visualization types. It includes dashboards, a chart builder, SQL Lab and datasets, with a plug-in architecture for custom visualizations.
-
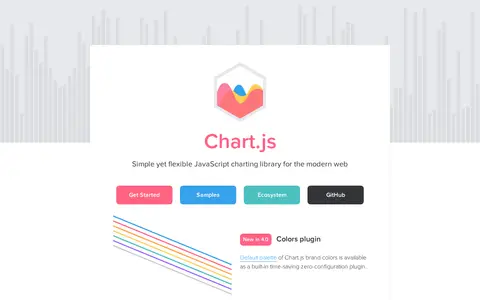
0Chart.js is an open source JavaScript charting library for the modern web, described as simple yet flexible. It supports eight animated and customisable chart types and renders on HTML5 Canvas across modern browsers, redrawing charts on window resize. Version 4.0 added a colors plugin and tree-shaking to reduce bundle size.
-
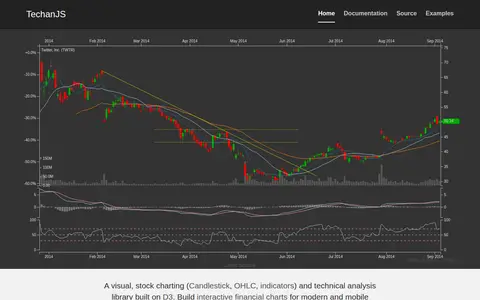
0TechanJS is a library built on D3 for financial charting and technical analysis. It provides visual stock charting, including candlestick, OHLC and indicators, for building interactive financial charts for modern and mobile browsers.
-
0DataLine is an AI data analysis and visualization tool that lets users chat with their data to generate tables, charts, and dashboards. The page describes it as suited to non-technical people querying data and to developers seeking a text2sql solution.
-
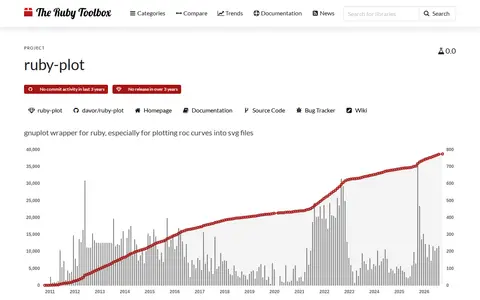
0ruby-plot is a Ruby wrapper around gnuplot, especially for plotting ROC curves into SVG files. It requires gnuplot to be installed and has had no release in over three years.
Community notes
Reviews and discussion
No reviews yet
Be the first to share how this project worked for you.
Join the discussion
Sign in with a verified account to leave a review or join the discussion.
Sign in to review