



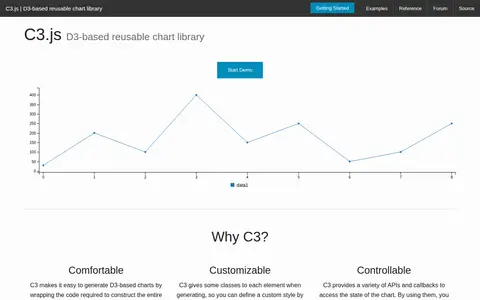

C3.js is a D3-based reusable chart library. It wraps the code required to construct entire charts, gives classes to elements for custom styling, and provides APIs and callbacks to access chart state and update charts after rendering.
d3py
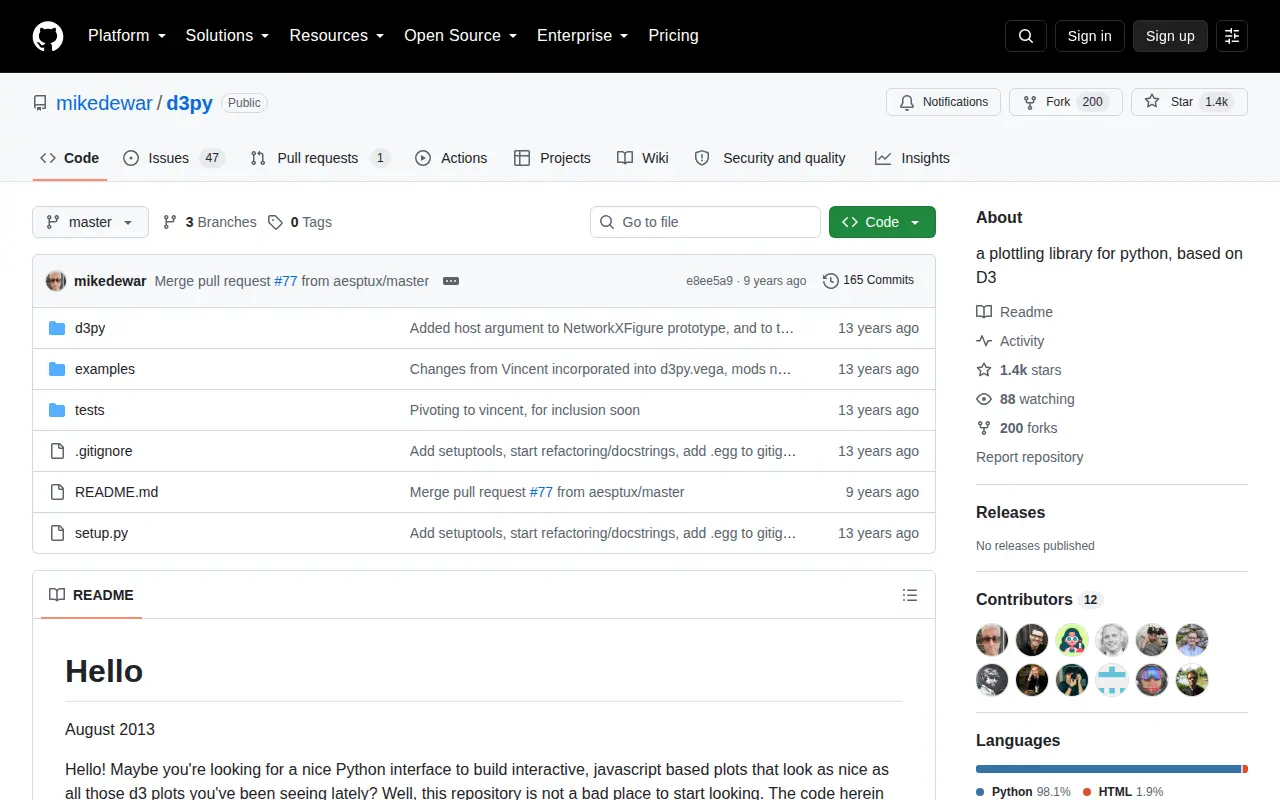
d3py is a plotting library for Python based on D3. It builds on d3.js and the pandas DataFrame module to plot data from the command line or simple scripts into a browser window. Its README describes the code as an experiment, notes that it is not actively developed, and points to vincent as an alternative.
Features
- a plotting library for python based on d3 Source: github.com
Links
Tags
-
0C3.js is a D3-based reusable chart library. It wraps the code required to construct entire charts, gives classes to elements for custom styling, and provides APIs and callbacks to access chart state and update charts after rendering.
-
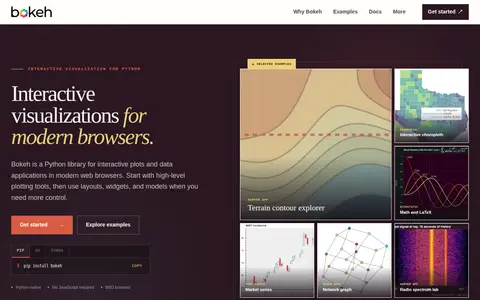
0Bokeh is a Python library for creating interactive plots, dashboards, and data applications in modern web browsers. Plots can go in Jupyter notebooks, be saved as standalone HTML, or run with live Python callbacks through the Bokeh server or embedded in an ASGI app. It includes tools for pan, zoom, hover, and selection.
-
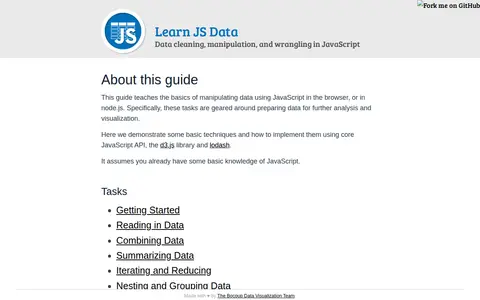
0A guide that introduces data processing and cleaning in JavaScript, teaching how to load, modify and transform data using JavaScript libraries. It covers tasks geared around preparing data for further analysis and visualization, demonstrated with core JavaScript API, d3.js and lodash. It assumes some basic knowledge of JavaScript.
-
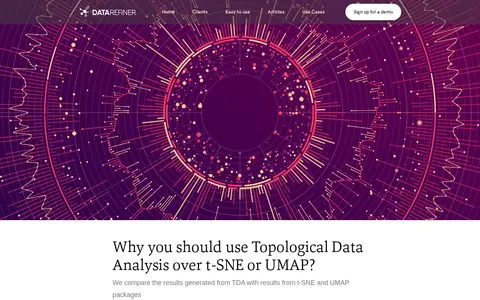
0An article comparing Topological Data Analysis results with those from t-SNE and UMAP packages. It discusses advantages of TDA coupled with self-supervised learning and covers case studies in IoT, image analysis and text analysis, plus open-source libraries for starting with TDA.
-
0The Data Engineering Show is a podcast for data engineering and BI practitioners. It features discussions with tech influencers about practical day-to-day data challenges and solutions. Episodes are available on platforms including Apple Podcasts, Spotify and Pocket Casts.
-
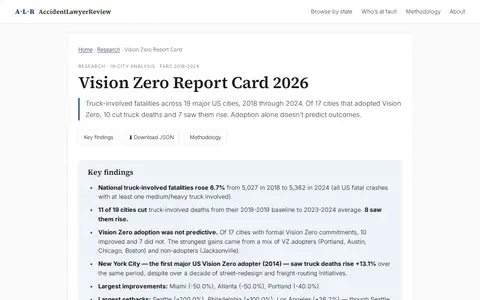
0Research report examining seven years of truck-involved fatalities, 2018 through 2024, across 19 major US cities, based on FARS data. It compares each city's 2018-2019 baseline average with its 2023-2024 average and notes that of 17 Vision Zero adopters, 10 improved and 7 did not.
Community notes
Reviews and discussion
No reviews yet
Be the first to share how this project worked for you.
Join the discussion
Sign in with a verified account to leave a review or join the discussion.
Sign in to review