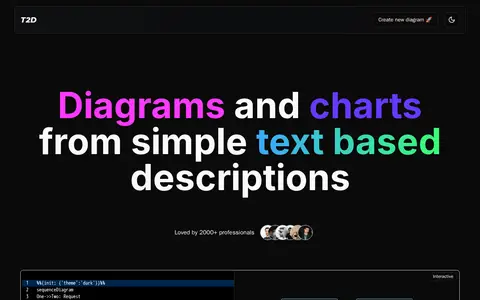
PlantUML is an open-source tool that uses simple textual descriptions to draw UML diagrams. It supports diagram types including sequence, use case, class, object, activity, component, deployment, state and timing diagrams, plus non-UML diagrams. Images can be exported in PNG, LaTeX, EPS and SVG.
Directory
Data Visualization
Explore Data Visualization resources in Creative & Design.

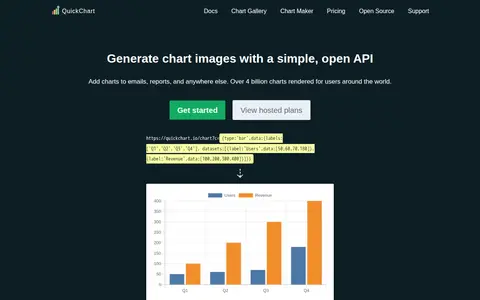
QuickChart is a web service that generates chart images on the fly from Chart.js configurations, suitable for embedding in email, SMS, chatbots and other formats. Charts are sent through a URL or POST request and rendered by the Chart.js library. It is dual licensed under the GNU AGPLv3 and a commercial license.
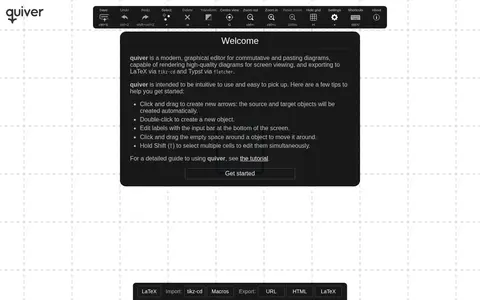
Quiver is a frontend design resource for CSS frameworks, UI components, and web interfaces.
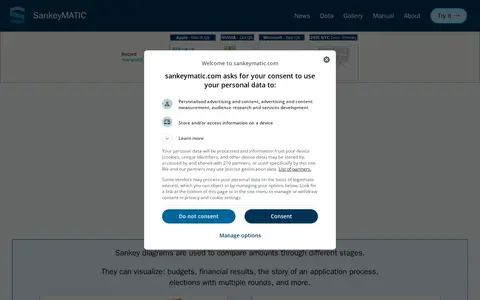
SankeyMATIC is an online Sankey diagram builder created in 2014 by Steve Bogart. Users enter flows in a Source [Amount] Target format and adjust diagrams with interactive controls. Diagrams can be exported as PNG or SVG images, and work can be saved as a plain text file. Data processing happens locally in the browser.
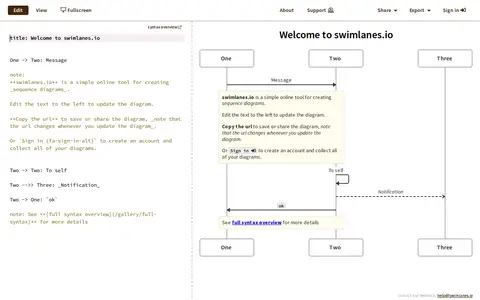
Swimlanes.io is a free webapp for making sequence diagrams. Users edit text and the diagram updates in real time. Diagrams can be downloaded as images or shared with a link, and the URL changes whenever the diagram is updated.
text2diagram is a storage, design, or frontend resource for mockups, assets, UI tools, or web search.
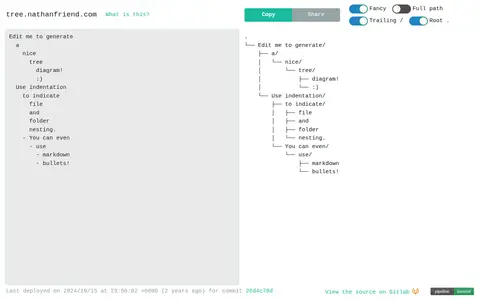
tree is a storage, design, or frontend resource for mockups, assets, UI tools, or web search.
UMLet is a free, open-source UML tool with a simple user interface for drawing UML diagrams. Sequence and activity diagrams can be created from plain text, and diagrams can be exported to eps, pdf, jpg, svg and the clipboard. It is available as a stand-alone app for Windows, macOS and Linux, as an Eclipse plugin, as the UMLetino web app and as a Visual Studio Code extension.
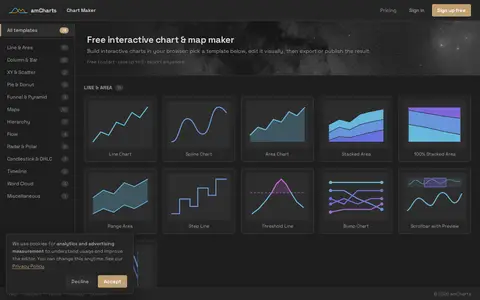
amCharts is a storage, design, or frontend resource for mockups, assets, UI tools, or web search.
ASCII Flow is a storage, design, or frontend resource for mockups, assets, UI tools, or web search.
Bar Graph Maker is a storage, design, or frontend resource for mockups, assets, UI tools, or web search.
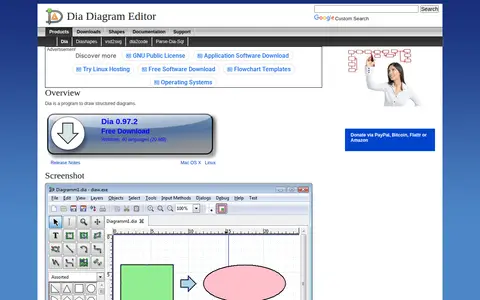
Dia is free, open-source drawing software for creating structured diagrams. A Windows version is available as a free download, and the download page also provides packages for Mac OS X and Linux. The software is released under the GNU General Public License, GPLv2.
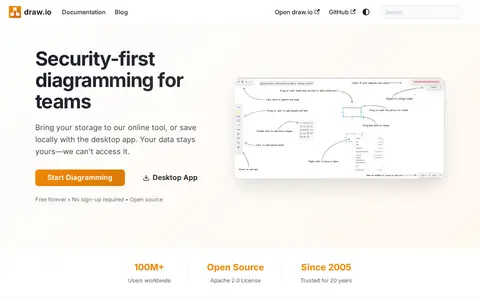
draw.io is a free diagramming application for drawing technical diagrams and web-based sketching. Diagrams can be stored in online storage platforms, a browser, a local device, or offline with a standalone desktop app. It integrates with platforms including Atlassian Confluence and Jira, Google applications, GitHub, GitLab, Microsoft applications and Notion.
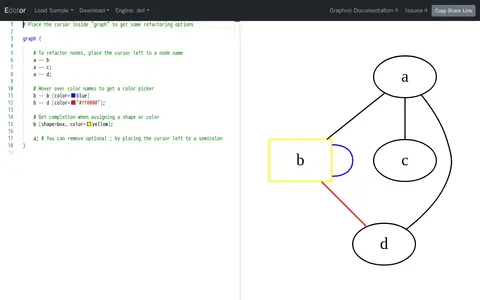
Editor is a storage, design, or frontend resource for mockups, assets, UI tools, or web search.
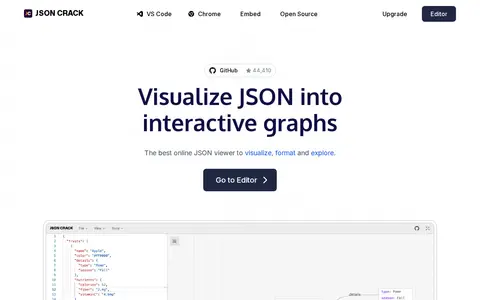
JSON Crack is a storage, design, or frontend resource for mockups, assets, UI tools, or web search.
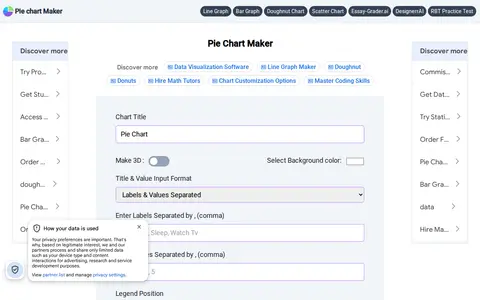
Pie Chart Maker is a free online tool for creating pie charts. Users enter labels and values, and can configure options such as background color, legend position, pie hole for a doughnut chart, 3D display and slice text. Charts can be downloaded as jpg, png or svg files.
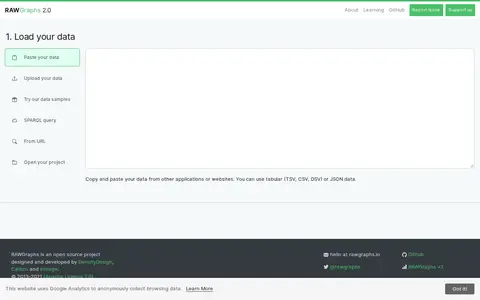
RAWGraphs is a storage, design, or frontend resource for mockups, assets, UI tools, or web search.
Terminal Render is a storage, design, or frontend resource for mockups, assets, UI tools, or web search.
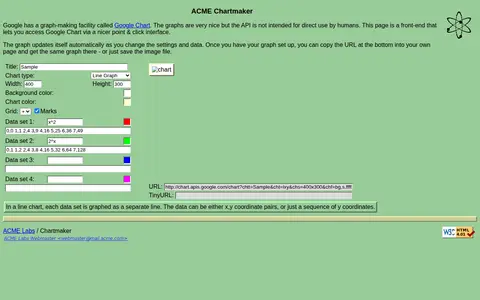
A front-end that provides a point-and-click interface for accessing Google Chart, intended because the Chart API is not meant for direct human use. The graph updates automatically as settings and data change, and users can copy the URL into their own page or save the image file.
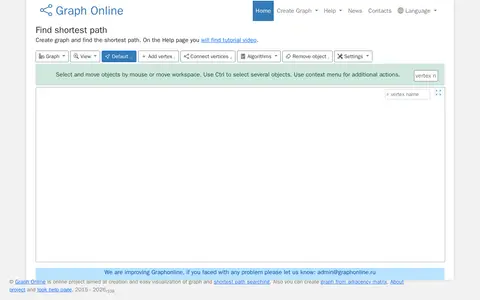
Graphonline is a storage, design, or frontend resource for mockups, assets, UI tools, or web search.
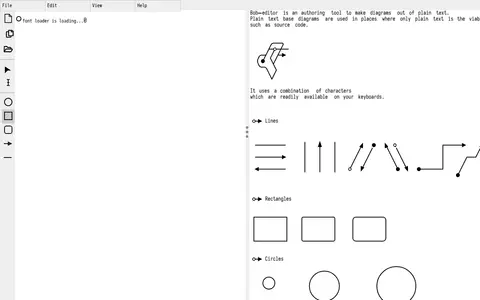
Bob Editor is a storage, design, or frontend resource for mockups, assets, UI tools, or web search.
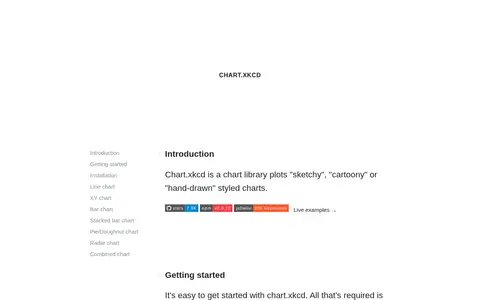
Chart.xkcd is a chart library that plots sketchy, cartoony or hand-drawn styled charts. It can be included via a script tag or installed via npm, and covers line, XY, bar, stacked bar, pie/doughnut, radar and combined charts. Options allow customization of the chart appearance.
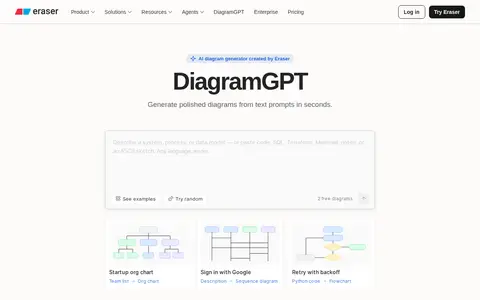
DiagramGPT is an AI diagram generator created by Eraser that generates diagrams from text prompts. Five diagram types are available: flow charts, entity relationship diagrams, cloud architecture diagrams, sequence diagrams and BPMN diagrams. Generated diagrams can be edited in Eraser. An API is available only to Starter, Business and Enterprise Plan teams.
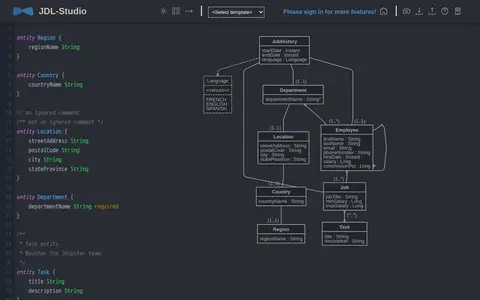
JDL Studio is a storage, design, or frontend resource for mockups, assets, UI tools, or web search.