Directory

Data Visualization

Explore Data Visualization resources in Creative & Design.

Data Visualization

59 listings
datavizcatalogue.com

The Data Visualisation Catalogue is a project by Severino Ribecca that provides a non-code-based library of information visualization types. The site serves as a learning and inspiration resource, offering a searchable guide to chart methods such as bar charts, heatmaps and treemaps. Example images mostly use dummy data.

Data Visualization 0
datawrapper.de

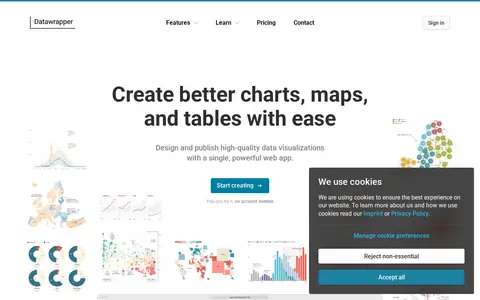
Datawrapper is an online tool for creating interactive charts, maps, and tables without code. It offers more than 20 chart types, over 4,000 basemaps for maps, and configurable tables. Visualizations are responsive and can be embedded on websites or exported to PowerPoint, PNG, PDF, and SVG. A step-based editor, custom themes, and real-time collaboration support design and publishing.

Data Visualization 0
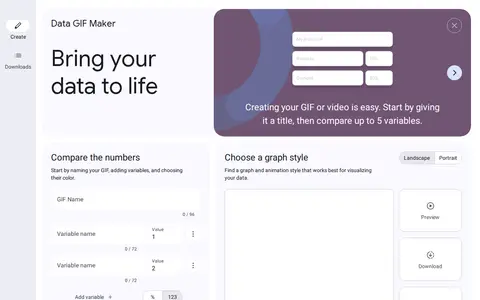
datagifmaker.withgoogle.com

Data GIF Maker is a storage, design, or frontend resource for mockups, assets, UI tools, or web search.

Data Visualization 0
github.com

Array Cat is a storage, design, or frontend resource for mockups, assets, UI tools, or web search.

Data Visualization 0
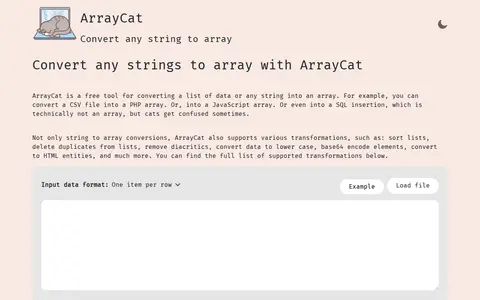
arraycat.com

ArrayCat is a browser-based tool for converting strings, lists and CSV columns into PHP, JavaScript, Python, Go, Delphi and Pascal arrays, JSON arrays, MySQL inserts or plain lists. It can remove duplicates, empty items and diacritics, sort lists, change letter case, normalize whitespace and encode Base64. Input is processed in the browser and not uploaded.

Data Visualization 0
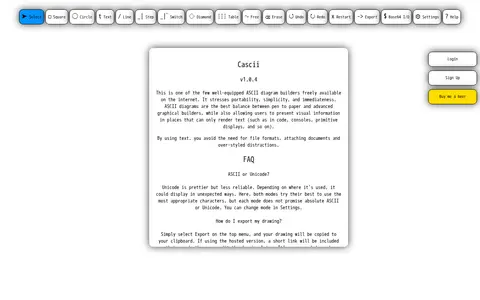
cascii.app

Cascii is a storage, design, or frontend resource for mockups, assets, UI tools, or web search.

Data Visualization 0
charts.hohli.com

Charts Builder is an online service for working with the Google Charts API. The Google Chart API lets users dynamically generate charts, and the service allows updating input data and changing the style of a chart preview.

Data Visualization 0
Preview unavailable
dgm.sh

DGM is a storage, design, or frontend resource for mockups, assets, UI tools, or web search.

Data Visualization 0
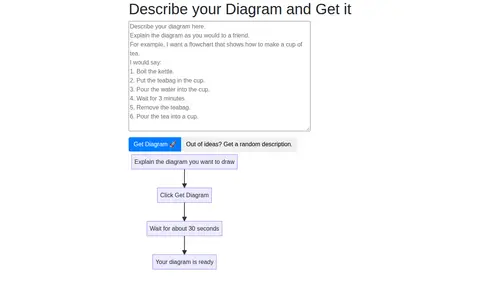
diagramify.agiliq.com

Diagramify is a storage, design, or frontend resource for mockups, assets, UI tools, or web search.

Data Visualization 0
drawdb.app

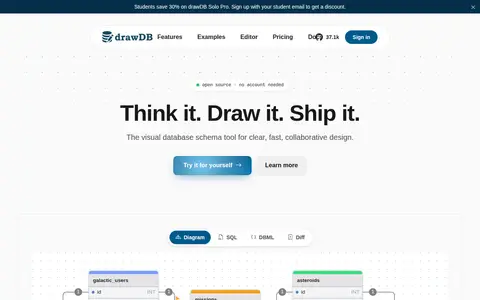
drawDB is a free, open-source online database schema design and ER diagram tool. It supports drawing ER diagrams, generating SQL for PostgreSQL, MySQL, SQLite, SQL Server and Oracle, and real-time collaboration. The editor runs in the browser with no account required, and Pro adds cloud storage, teams and collaboration.

Data Visualization 0
flourish.studio

Flourish is a storage, design, or frontend resource for mockups, assets, UI tools, or web search.

Data Visualization 0
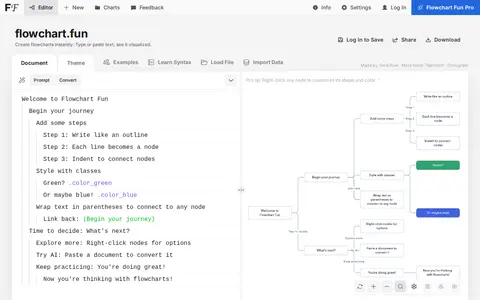
flowchart.fun

flowchart fun is a storage, design, or frontend resource for mockups, assets, UI tools, or web search.

Data Visualization 0
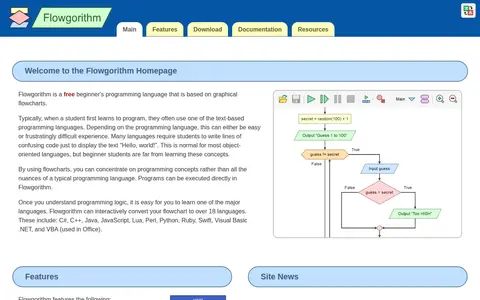
flowgorithm.org

Flowgorithm is a free beginner's programming language based on graphical flowcharts. Programs can be executed in Flowgorithm, which can interactively convert flowcharts to over 18 languages including C#, C++, Java, JavaScript, Python and Swift. It features a graphical variable watch window, loops, arrays and multilingual support.

Data Visualization 0
gephi.org

Gephi is free, open-source software for network visualization and analysis. It is available as a desktop application and as Gephi Lite in the browser. It includes algorithms for community detection, centrality measures and clustering, multiple layout algorithms, appearance customization and image exports. The source code is released under the GPL license.

Data Visualization 0
graphviz.org

Graphviz is a storage, design, or frontend resource for mockups, assets, UI tools, or web search.

Data Visualization 0
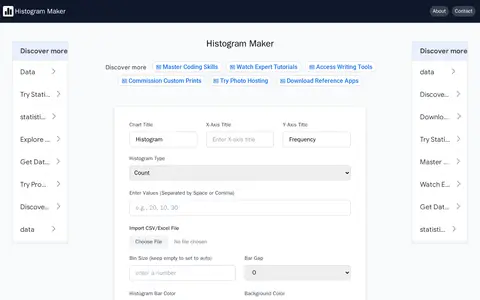
histogrammaker.net

histogrammaker is a storage, design, or frontend resource for mockups, assets, UI tools, or web search.

Data Visualization 0
Preview unavailable
kroki.io

Kroki is a storage, design, or frontend resource for mockups, assets, UI tools, or web search.

Data Visualization 0
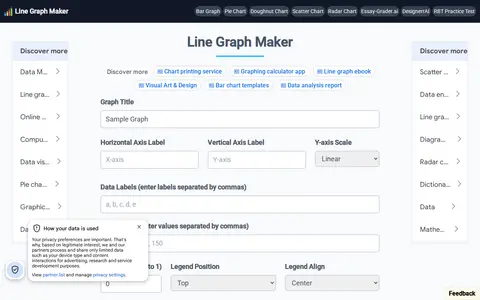
linegraphmaker.co

LineGraphMaker is an online tool for creating line graphs. Users add a title and axis labels, enter data labels and values separated by commas, adjust line tension, set axis scale and grid lines, and download the graph as a JPG or PNG file.

Data Visualization 0
makegraph.app

MakeGraph is a storage, design, or frontend resource for mockups, assets, UI tools, or web search.

Data Visualization 0
mermaid.live

Mermaid is a storage, design, or frontend resource for mockups, assets, UI tools, or web search.

Data Visualization 0
paraview.org

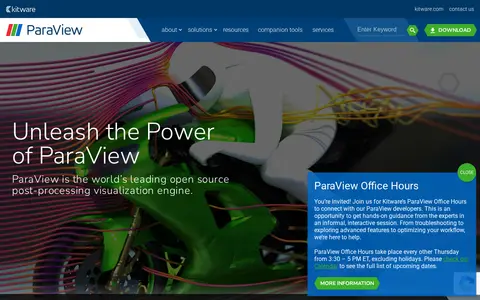
ParaView is an open-source, multi-platform data analysis and visualization application built to analyze extremely large datasets using distributed memory computing resources. It runs on Linux, macOS and Windows, from laptops to supercomputers, and includes readers for many file formats and more than 200 filters. It can also run in situ using ParaView Catalyst and in a web browser using trame.

Data Visualization 0
percival.ink

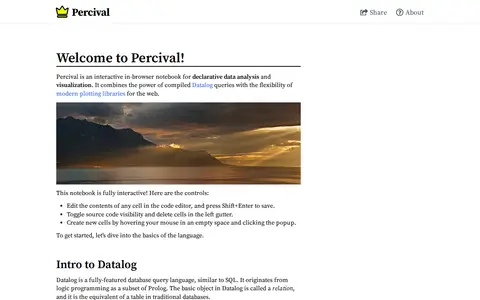
Percival is a storage, design, or frontend resource for mockups, assets, UI tools, or web search.

Data Visualization 0
piechartmaker.me

Piechartmaker is a storage, design, or frontend resource for mockups, assets, UI tools, or web search.

Data Visualization 0
Preview unavailable
planttext.com

PlantText is a storage, design, or frontend resource for mockups, assets, UI tools, or web search.

Data Visualization 0

Compare listed projects

Details from each project's website. Open a listing for its full overview.