


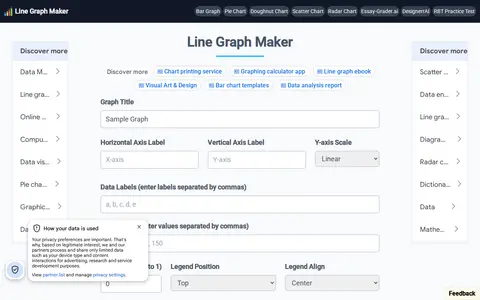

LineGraphMaker is an online tool for creating line graphs. Users add a title and axis labels, enter data labels and values separated by commas, adjust line tension, set axis scale and grid lines, and download the graph as a JPG or PNG file.
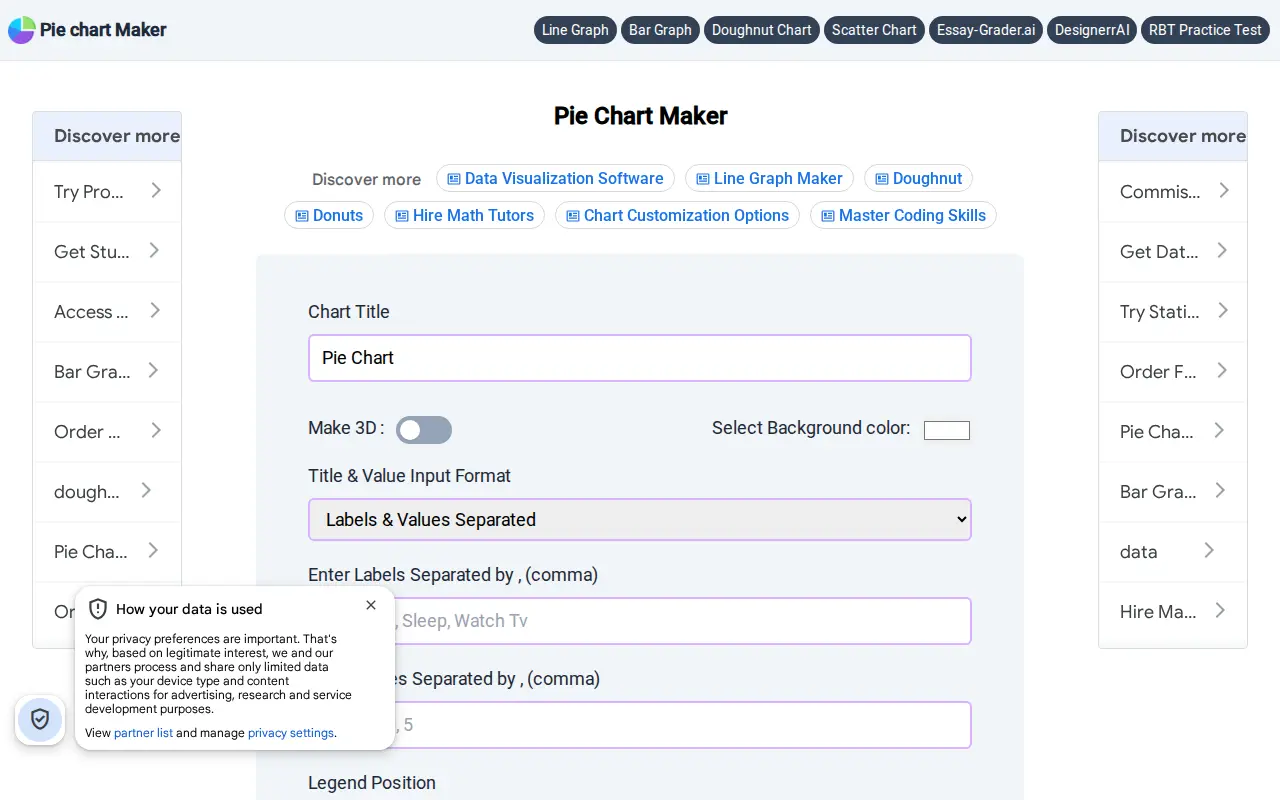
Pie Chart Maker
Pie Chart Maker is a free online tool for creating pie charts. Users enter labels and values, and can configure options such as background color, legend position, pie hole for a doughnut chart, 3D display and slice text. Charts can be downloaded as jpg, png or svg files.
Features
- download the Pie Chart as jpg, png or svg file Source: piechartmaker.co
Limitations
- A pie chart is more suitable for small data sets Source: piechartmaker.co
Links
Tags
-
0LineGraphMaker is an online tool for creating line graphs. Users add a title and axis labels, enter data labels and values separated by commas, adjust line tension, set axis scale and grid lines, and download the graph as a JPG or PNG file.
-
0Orion Icon Library is an icon tool offering free SVG and PNG icons. The site lists 3,415 free SVG vector icons and describes an advanced interactive web app with line, solid, color and flat styles, plus a free plan and an unlimited plan.
-
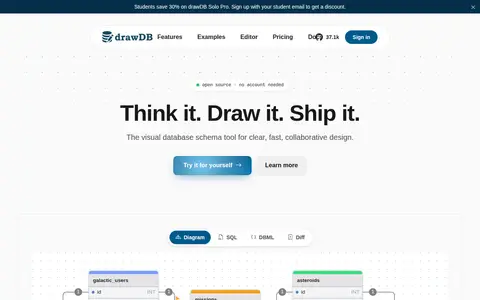
0drawDB is a free, open-source online database schema design and ER diagram tool. It supports drawing ER diagrams, generating SQL for PostgreSQL, MySQL, SQLite, SQL Server and Oracle, and real-time collaboration. The editor runs in the browser with no account required, and Pro adds cloud storage, teams and collaboration.
-
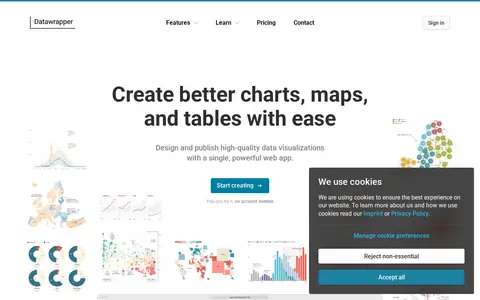
0Datawrapper is an online tool for creating interactive charts, maps, and tables without code. It offers more than 20 chart types, over 4,000 basemaps for maps, and configurable tables. Visualizations are responsive and can be embedded on websites or exported to PowerPoint, PNG, PDF, and SVG. A step-based editor, custom themes, and real-time collaboration support design and publishing.
-
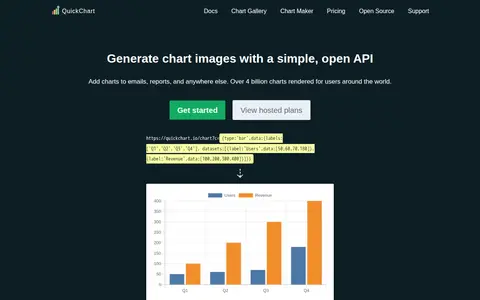
0QuickChart is a web service that generates chart images on the fly from Chart.js configurations, suitable for embedding in email, SMS, chatbots and other formats. Charts are sent through a URL or POST request and rendered by the Chart.js library. It is dual licensed under the GNU AGPLv3 and a commercial license.
-
0UMLet is a free, open-source UML tool with a simple user interface for drawing UML diagrams. Sequence and activity diagrams can be created from plain text, and diagrams can be exported to eps, pdf, jpg, svg and the clipboard. It is available as a stand-alone app for Windows, macOS and Linux, as an Eclipse plugin, as the UMLetino web app and as a Visual Studio Code extension.
Community notes
Reviews and discussion
No reviews yet
Be the first to share how this project worked for you.
Join the discussion
Sign in with a verified account to leave a review or join the discussion.
Sign in to review