
harvarddatascience.com
Harvard Data Science applies AI to data analysis, extraction, visualization, or business intelligence.
Directory
AI data and analytics covers tools that use machine learning to query, analyse or visualise data. Entries include analytics platforms, notebook environments, data-cleaning utilities, charting tools and assistants that help write queries or summarise results. Some are general business tools, and others are research projects applying AI to a specific kind of data. Before uploading anything, check where your data is stored, what export options exist and how the tool handles uncertainty. These tools often handle private information, so read the terms on the source first, and verify generated numbers against the original data.
Harvard Data Science applies AI to data analysis, extraction, visualization, or business intelligence.

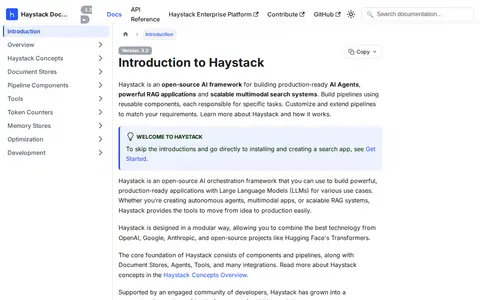
Modular pipelines for retrieval and generative AI applications.

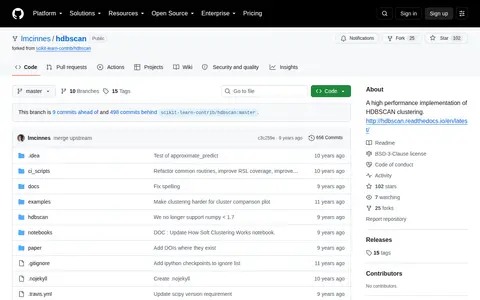
HDBSCAN is a high performance implementation of hierarchical density-based clustering. It performs DBSCAN over varying epsilon values and integrates results to find a clustering with the best stability over epsilon, allowing clusters of varying densities. The package inherits from sklearn classes and supports arrays, pandas dataframes, sparse matrices or distance matrices as input.

High Charts is a JavaScript charting library designed for use in web applications, dashboards, grids and frameworks including React. It offers products for core charting, stock data, maps, Gantt charts, grids and dashboards, and is used by a large number of global enterprises. The library provides built-in adaptive functionality and extensive customization options for interactive data visualizations.

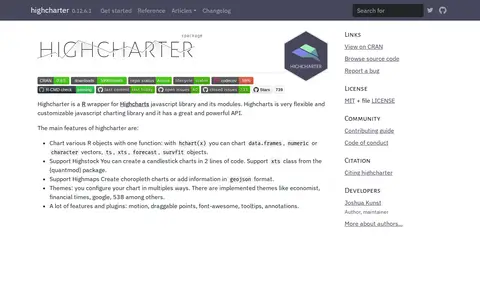
Highcharter is an R wrapper for the Highcharts JavaScript charting library and its modules, delivered through an htmlwidget. The hchart(x) function charts data frames, vectors, ts, xts, forecast and survfit objects. It supports Highstock candlestick charts, Highmaps choropleth charts, themes, and plugins. Highcharts offers a commercial license and a free non-commercial license; the package does not provide a Highcharts license.

How to Become a Data Scientist applies AI to data analysis, extraction, visualization, or business intelligence.
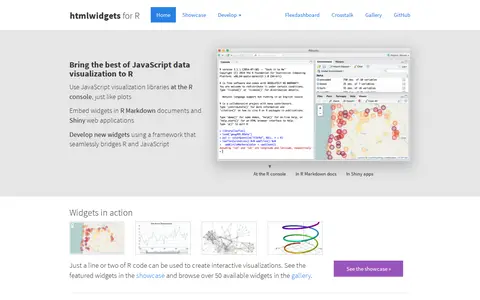
HTML widgets are R packages that produce interactive web visualizations, working like R plots. A line or two of R code produces a D3 graphic or Leaflet map. Widgets run at the R console and can be embedded in R Markdown reports and Shiny web applications. The page lists widget examples including Leaflet, dygraphs, Plotly and Highcharter, and describes composing dashboards with flexdashboard and linking widgets with crosstalk. New widgets can be developed by bridging R and JavaScript.

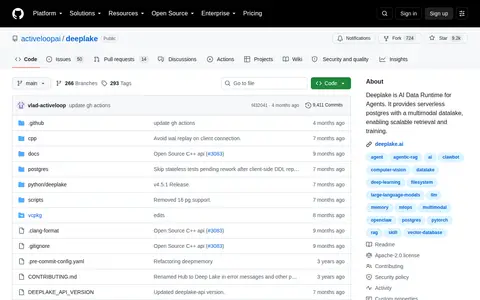
A dataset format for creating, storing, and collaborating on AI datasets of any size.

Analyzes structured data and helps produce queries, insights or visualizations.

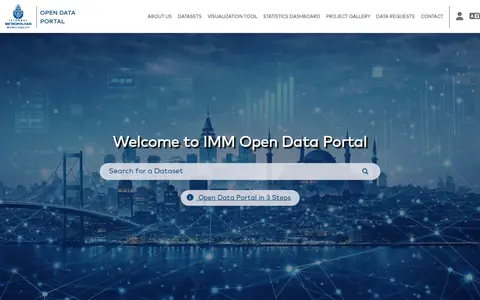
Istanbul Metropolitan Municipality's open data platform enables users to search for datasets by keyword or topic, review them, and download data or query it via API to create projects. Published datasets are labeled under categories such as energy, economy, environment, mobility and governance.

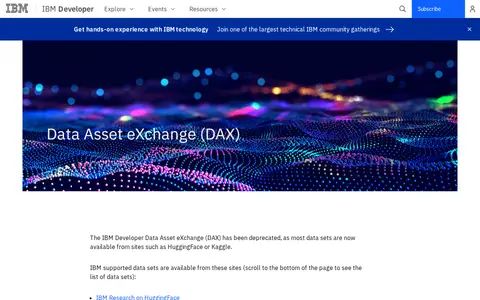
IBM Asset Dataset refers to the deprecated IBM Developer Data Asset eXchange (DAX). Most of its datasets are now hosted on HuggingFace or Kaggle, while IBM Project Debater datasets are available via the IBM Research Haifa site.

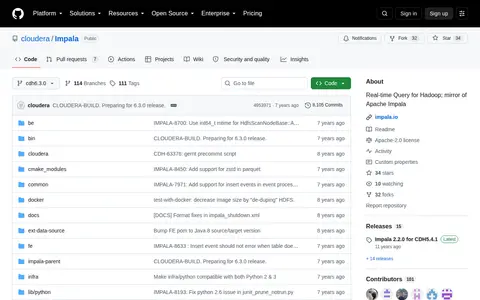
Impala is a distributed C++ query engine for SQL queries over petabytes of data stored in Apache Hadoop clusters. It supports data in HDFS, Apache HBase and Amazon S3, window functions and subqueries, and uses LLVM for on-the-fly code generation. It is Apache-licensed and open source, and the repository is a mirror of Apache Impala.
Import.io is a web data extraction and AI infrastructure platform. It converts website content into structured data, and provides web scraping tools, managed data services, pricing intelligence, and MCP tools for AI agents. It supports use cases across multiple industries including retail, ecommerce and AI development.

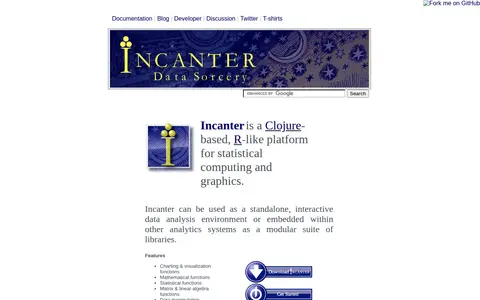
Incanter is a Clojure-based, R-like platform for statistical computing and graphics. It provides charting and visualization, mathematical, statistical, matrix and linear algebra, and data manipulation functions. It can be used as a standalone interactive data analysis environment or embedded within other analytics systems as a modular suite of libraries.

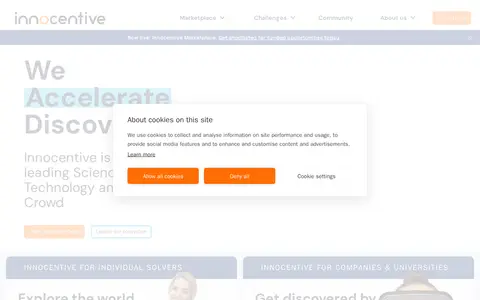
InnoCentive describes itself as a science, technology and innovation crowd connecting organizations with individual solvers. Companies and universities post challenges with awards, while solvers submit proposals; the site lists live challenges and a marketplace for funded opportunities.

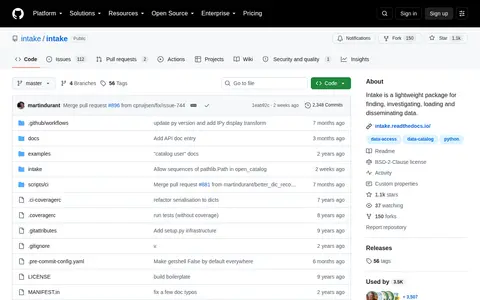
Intake is a lightweight package for finding, investigating, loading, and disseminating data. It is hosted on GitHub at https://github.com/intake/intake. The repository includes documentation, installation instructions, development guidelines, and support information.

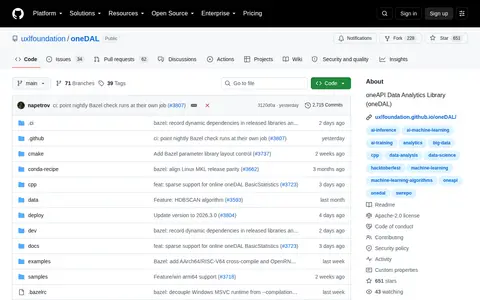
The oneAPI Data Analytics Library (oneDAL) is a library for data analytics. It is hosted on GitHub under the uxlfoundation/oneDAL repository. The repository provides usage examples, installation instructions, and documentation.

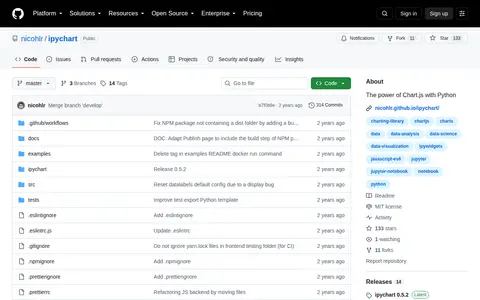
ipychart is a Python library that brings the power of Chart.js to Python. It is hosted on GitHub at https://github.com/nicohlr/ipychart. The repository includes installation instructions, documentation, usage examples, and development information.
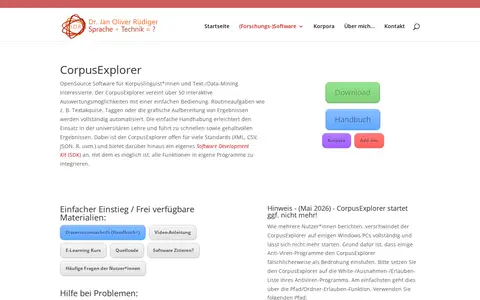
ML, DL and Data Science - with a focus on text-/data-mining.
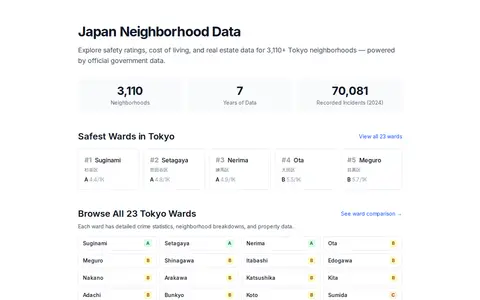
Japan Neighborhoods provides data-driven neighborhood guides for Japan. It offers crime statistics, safety scores, demographic data, cost of living, and real estate information for over 5,000 Tokyo neighborhoods. The data is sourced from official government sources and presented through safety rankings, interactive maps, and property listings.

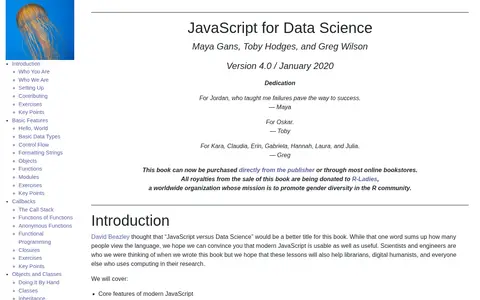
A book titled JavaScript for Data Science by Maya Gans, Toby Hodges, and Greg Wilson, version 4.0, dated January 2020. It covers topics such as callbacks, promises, objects, classes, HTML, CSS, React, data services, testing, data visualization, and a three-tier web application, with an even mix of browser and server programming. It is intended for scientists and engineers.
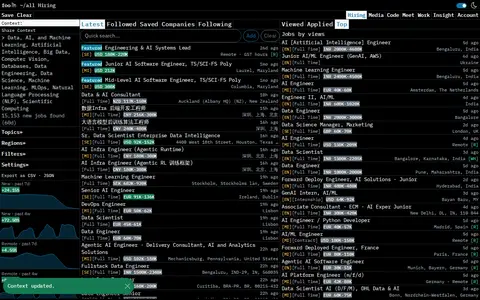
The go-to, no-nonsense, fast and lean job site in AI, ML, Data Science and Big Data.

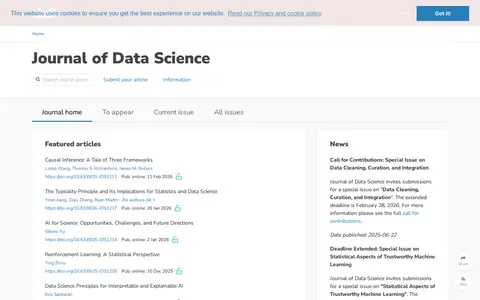
The Journal of Data Science is an academic journal listing featured articles, news, and calls for contributions. Featured articles include items on causal inference, reinforcement learning, and AI for science, each with a DOI and online publication date. The page also lists special issue calls for contributions and most-read articles.

JSON Schema is a declarative language for annotating and validating JSON documents' structure, constraints, and data types. It enables JSON data consistency, validity, and interoperability, and has a tooling ecosystem of validators, generators, and linters. Documentation covers schema design, guides, and keyword reference.