


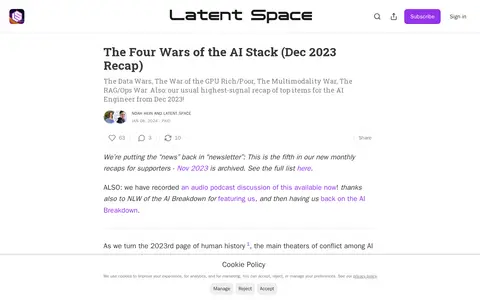

A paid monthly recap newsletter for AI engineers covering December 2023 developments. It frames AI industry activity around four areas: Data Wars, the GPU Rich/Poor War, the Multimodality War, and the RAG/Ops War, and also recaps top items for AI engineers.
Harvard Data Science
Harvard Data Science applies AI to data analysis, extraction, visualization, or business intelligence.
Links
Tags
-
0A paid monthly recap newsletter for AI engineers covering December 2023 developments. It frames AI industry activity around four areas: Data Wars, the GPU Rich/Poor War, the Multimodality War, and the RAG/Ops War, and also recaps top items for AI engineers.
-
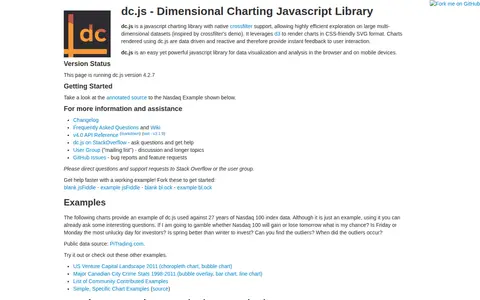
0dc.js is a JavaScript charting library with native crossfilter support for exploring large multi-dimensional datasets. It uses d3 to render charts in CSS-friendly SVG format. Charts are data driven and reactive, providing instant feedback to user interaction. The library is described as usable in the browser and on mobile devices.
-
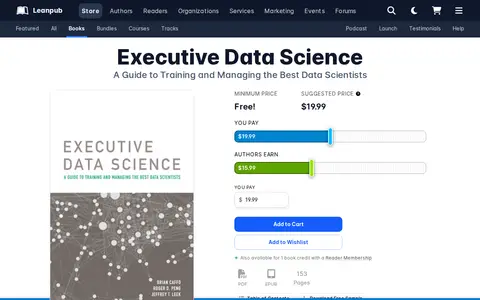
0A book by Brian Caffo, Roger D. Peng and Jeffrey Leek on assembling and leading a data science enterprise, based on the Johns Hopkins Executive Data Science Specialization. It covers a crash course in data science, recruiting and evaluating a team, and the structure of the data science pipeline. Available as PDF and EPUB; printed copies are sold through Lulu.
-
0
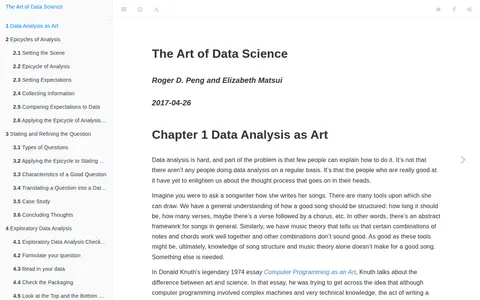
A book by Roger D. Peng and Elizabeth Matsui, dated 2017, about data analysis as an art. It discusses the thought process behind data analysis and covers R software development for building data science tools, including handling complex data, building R packages and custom data visualizations.
-
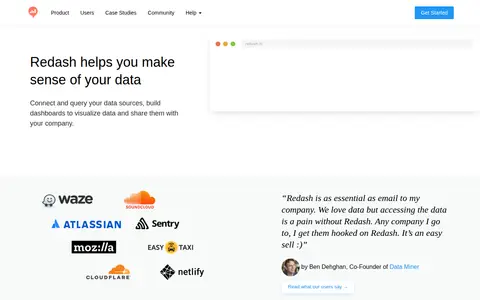
0Redash is an open source tool for connecting to data sources, querying, visualizing and sharing data. It supports SQL, NoSQL, Big Data and API sources including PostgreSQL, MySQL, Redshift, BigQuery and MongoDB. Users build dashboards, set alerts and manage access.
-
0Chart.js is an open source JavaScript charting library for the modern web, described as simple yet flexible. It supports eight animated and customisable chart types and renders on HTML5 Canvas across modern browsers, redrawing charts on window resize. Version 4.0 added a colors plugin and tree-shaking to reduce bundle size.
Community notes
Reviews and discussion
No reviews yet
Be the first to share how this project worked for you.
Join the discussion
Sign in with a verified account to leave a review or join the discussion.
Sign in to review