
github.com
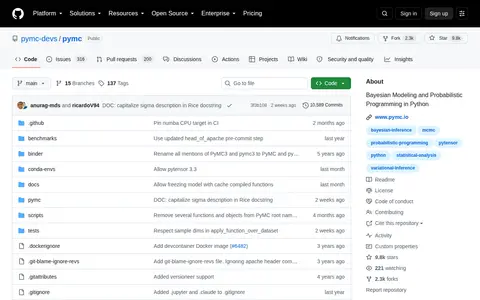
Markov Chain Monte Carlo sampling toolkit.
Directory
AI data and analytics covers tools that use machine learning to query, analyse or visualise data. Entries include analytics platforms, notebook environments, data-cleaning utilities, charting tools and assistants that help write queries or summarise results. Some are general business tools, and others are research projects applying AI to a specific kind of data. Before uploading anything, check where your data is stored, what export options exist and how the tool handles uncertainty. These tools often handle private information, so read the terms on the source first, and verify generated numbers against the original data.
Markov Chain Monte Carlo sampling toolkit.

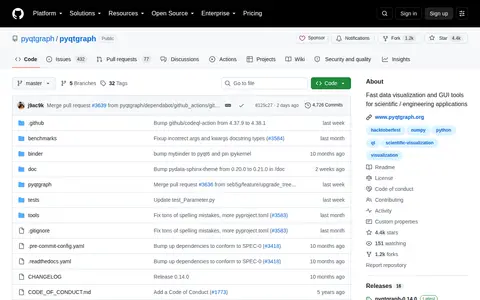
PyQtGraph is a pure-Python graphics library that uses the Qt framework. It is intended for mathematics, scientific and engineering applications, and relies on numpy for number crunching, Qt's GraphicsView for 2D display and OpenGL for 3D display. It supports Python 3.12+, Qt 5.15 or 6.8+, and numpy 2.2+.
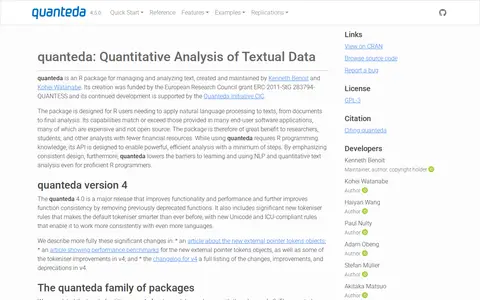
quanteda is an R package for managing and analyzing text, described as a fast, flexible, and comprehensive framework for quantitative text analysis in R. It provides functionality for corpus management, tokens and n-grams, keywords in context, sparse matrices, content dictionaries, and supervised and unsupervised machine learning.

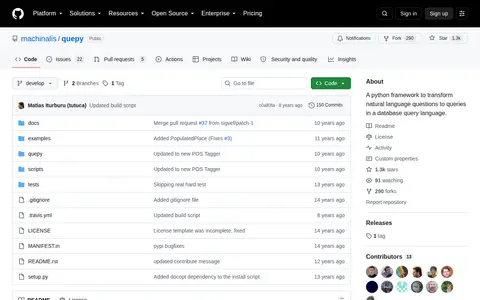
A python framework to transform natural language questions to queries in a database query language.

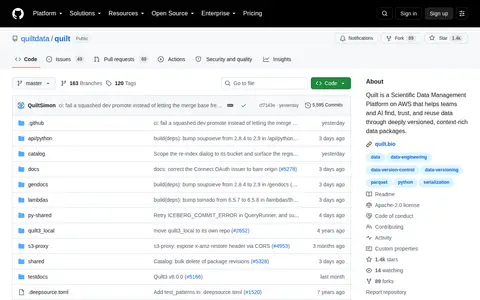
Quilt is a scientific data management platform hosted on Amazon Web Services (AWS) that helps teams and AI systems locate, verify the trustworthiness of, and reuse data via deeply versioned, context-rich data packages.
Open source GPU accelerated data science libraries.

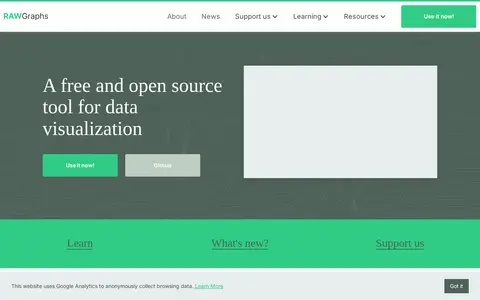
RAWGraphs is a free and open source tool for data visualization. It is a web app that offers almost 30 visual models to visualize quantities, hierarchies and time series. Data inserted is processed only by the web browser, and projects can be saved or exported as vector or raster images.

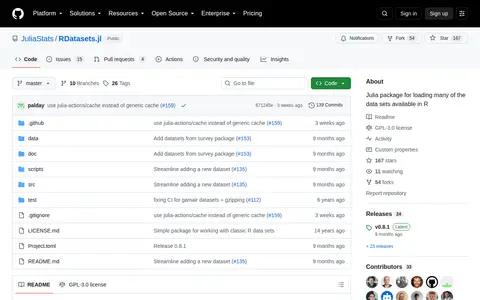
Julia package for loading many of the data sets available in R.

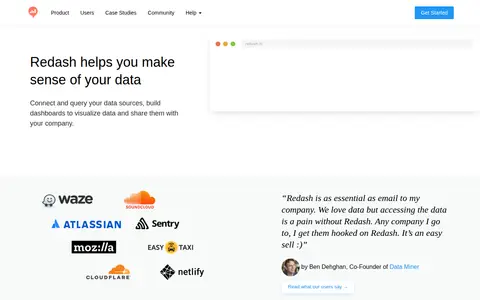
Redash is an open source tool for connecting to data sources, querying, visualizing and sharing data. It supports SQL, NoSQL, Big Data and API sources including PostgreSQL, MySQL, Redshift, BigQuery and MongoDB. Users build dashboards, set alerts and manage access.

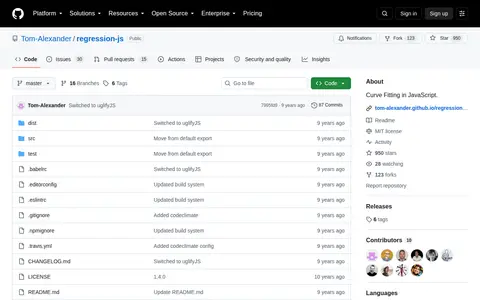
regression-js is a JavaScript library for curve fitting. It is hosted on GitHub and can be contributed to by the community. It is open source and available for installation via npm.

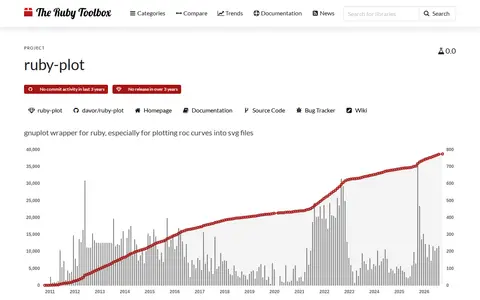
ruby-plot is a Ruby wrapper around gnuplot, especially for plotting ROC curves into SVG files. It requires gnuplot to be installed and has had no release in over three years.

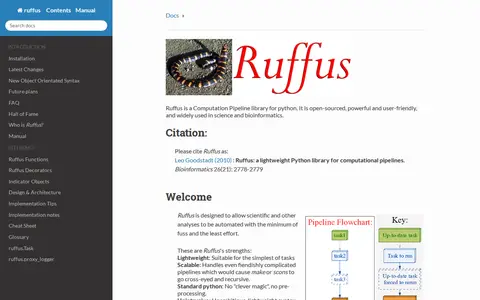
Ruffus is an open-source computation pipeline library for Python, used in science and bioinformatics. It is designed to automate scientific and other analyses with a lightweight, standard-Python syntax, and can be installed from the Python Package Index.

Runcell is an AI agent for Jupyter notebooks that automates writing and executing Python code, debugging, and explaining data analysis results. It operates within the notebook environment, inspecting context and planning multi-step workflows autonomously.

Analyzes structured data and helps produce queries, insights or visualizations.

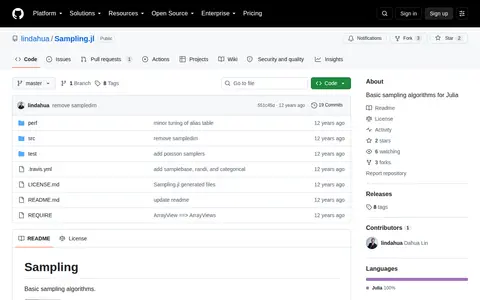
Basic sampling algorithms for Julia.
Analyzes structured data and helps produce queries, insights or visualizations.

Analyzes structured data and helps produce queries, insights or visualizations.

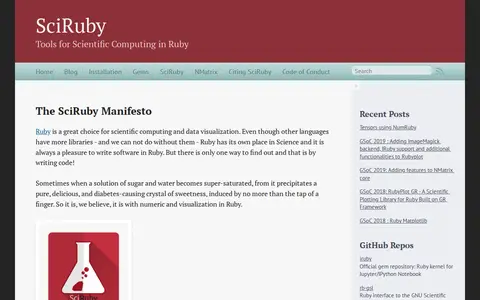
SciRuby is a project providing tools for scientific computing and data visualization in Ruby. Its releases include NMatrix, a linear algebra library with dense and sparse matrix storage and tensor support, alongside visualization and statistics gems. The project describes itself as currently alpha, and it notes its gems are tested but not battle-hardened. SciRuby and NMatrix are available under the BSD three-clause license.

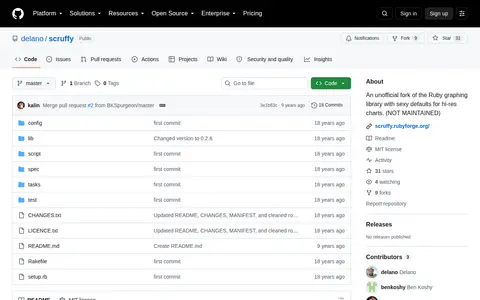
Scruffy is an unofficial fork of the Ruby graphing library, based on the official 0.2.5 release, intended for hi-resolution graphs and charts. It renders to SVG or bitmap formats such as PNG and JPG. The fork is marked as not maintained.

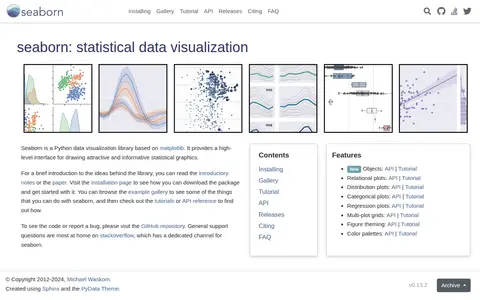
Seaborn is a Python data visualization library based on matplotlib. It provides a high-level interface for drawing statistical graphics, and covers relational, distribution, categorical, regression and multi-plot grids, along with figure theming and color palettes.

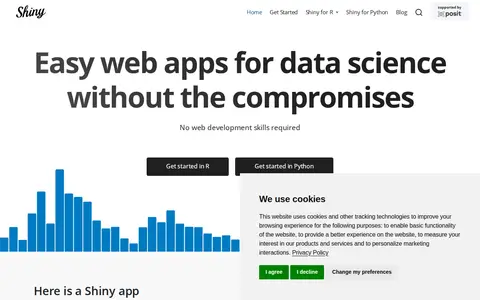
Shiny is an R and Python package for creating interactive web apps, letting users interact with data and analysis without web development skills. Apps can be written from R or Python. Questions are answered through Posit Community and Stack Overflow, with subscription support for hosting services.

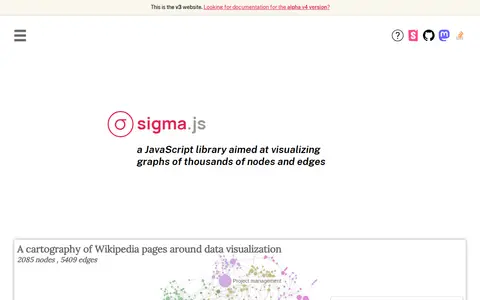
Sigma.js is a WebGL-powered JavaScript library for interactive graph visualization, built on graphology. It provides GPU-accelerated rendering, built-in pan, zoom, hover and multi-touch interactions, and works with React, Angular, Vue or vanilla JavaScript. Layouts, metrics and community detection come via graphology's standard library.

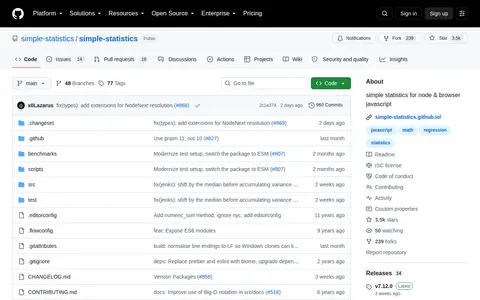
Simple Statistics is a JavaScript implementation of descriptive, regression, and inference statistics. It is written in literate JavaScript with no dependencies and is designed to work in all modern browsers and in Node.js. The repository is published under an ISC license.

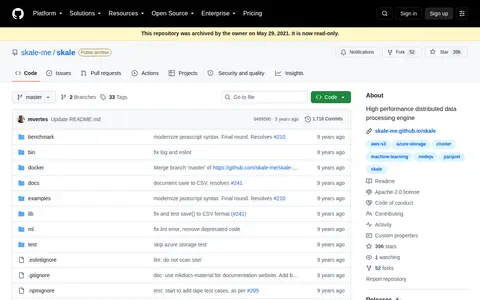
Skale is a distributed data processing and machine learning engine that provides a high-level API in JavaScript and a parallel execution engine on top of Node.js. The repository was archived by its owner on May 29, 2021 and is read-only. It supports multiple data sources and formats, and can run in local or distributed mode.