
This Hugging Face Space generates SQL queries from natural language for datasets on Hugging Face; users enter a dataset and a query. The Space is currently paused, and the author can be asked to restart it.
Directory
AI Data & Analytics
AI data and analytics covers tools that use machine learning to query, analyse or visualise data. Entries include analytics platforms, notebook environments, data-cleaning utilities, charting tools and assistants that help write queries or summarise results. Some are general business tools, and others are research projects applying AI to a specific kind of data. Before uploading anything, check where your data is stored, what export options exist and how the tool handles uncertainty. These tools often handle private information, so read the terms on the source first, and verify generated numbers against the original data.
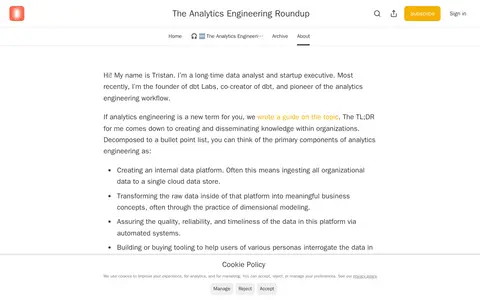
The Analytics Engineering Roundup is a Substack newsletter curating articles on analytics engineering and its adjacent ecosystem, curated by Tristan Handy. He describes analytics engineering as creating and disseminating knowledge within organizations, covering cloud data platforms, dimensional modeling and data quality.
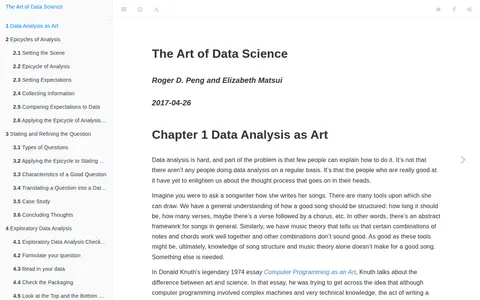
A book by Roger D. Peng and Elizabeth Matsui, dated 2017, about data analysis as an art. It discusses the thought process behind data analysis and covers R software development for building data science tools, including handling complex data, building R packages and custom data visualizations.
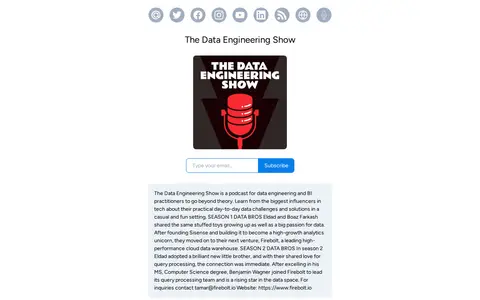
The Data Engineering Show is a podcast for data engineering and BI practitioners. It features discussions with tech influencers about practical day-to-day data challenges and solutions. Episodes are available on platforms including Apple Podcasts, Spotify and Pocket Casts.
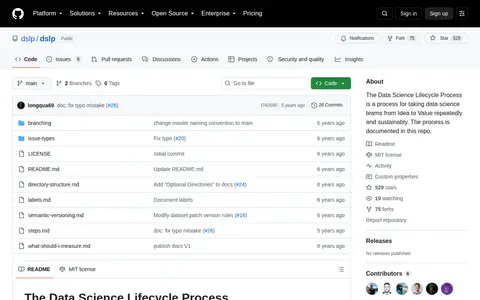
The Data Science Lifecycle Process is a repeatable, sustainable process for guiding data science teams from initial idea to delivered value. The process is fully documented in the public GitHub repository dslp/dslp.
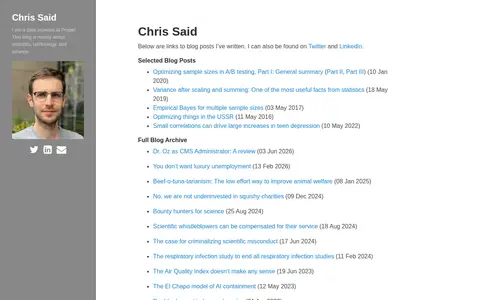
A personal blog by Chris Said, a data scientist at Propel. The blog is mostly about statistics, technology, and science, and the site links to blog posts on topics such as A/B testing and statistics.
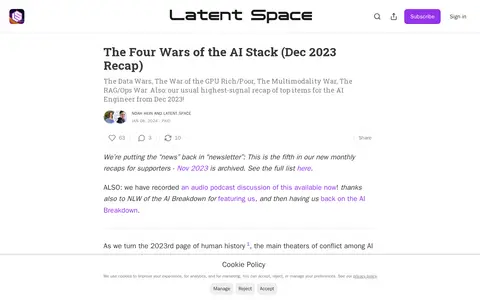
A paid monthly recap newsletter for AI engineers covering December 2023 developments. It frames AI industry activity around four areas: Data Wars, the GPU Rich/Poor War, the Multimodality War, and the RAG/Ops War, and also recaps top items for AI engineers.
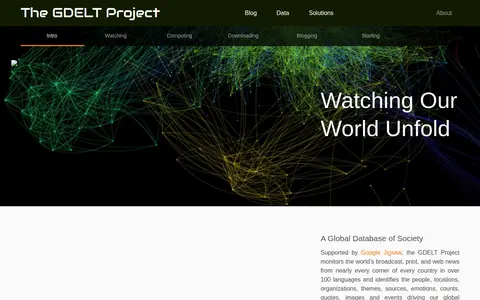
The GDELT Project monitors broadcast, print and web news from nearly every country in over 100 languages, identifying people, locations, organizations, themes, sources, emotions, counts, quotes, images and events. Its archives date back to January 1, 1979 and update every 15 minutes. Data can be downloaded as raw CSV files, visualized with the GDELT Analysis Service, or queried with Google BigQuery.
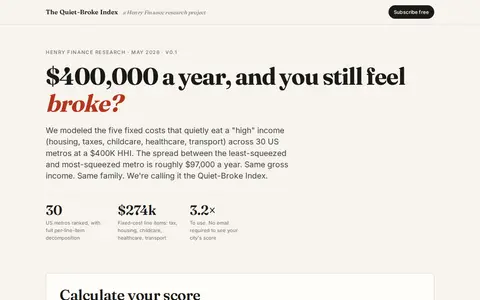
The Quiet-Broke Index is a research project modeled by Henry Finance that estimates the high-earner squeeze across 30 US metros at a $400,000 household income. It combines five fixed costs: housing, taxes, childcare, healthcare and transportation. A calculator gives a 0–100 score from five inputs, and the site ranks cities and reports per-line-item decomposition.
Think Stats is an introduction to probability and statistics for Python programmers, emphasizing simple techniques for exploring real data sets and answering questions. It includes case studies using datasets from the National Institutes of Health and other sources, with exercises using short programs. The second edition is no longer current and is available under a Creative Commons license.
TimeSeries.jl is a lightweight framework for working with time series data in Julia. It is installed through the Julia package manager and provides a TimeArray type built from date or timestamp ranges and values.
Tonic is a tool for downloading, manipulating and loading event-based or spike-based data, described as similar to PyTorch Vision but for neuromorphic data. It provides event datasets and transformations, and the project states it is looking for a new maintainer.
Scripts to load several popular datasets including:.
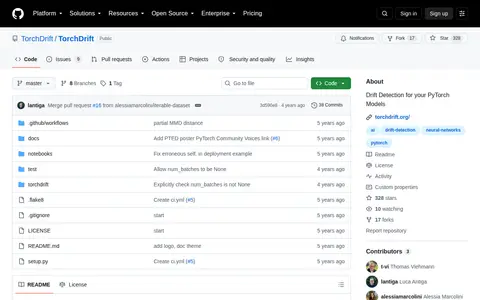
A data and concept drift library for PyTorch.
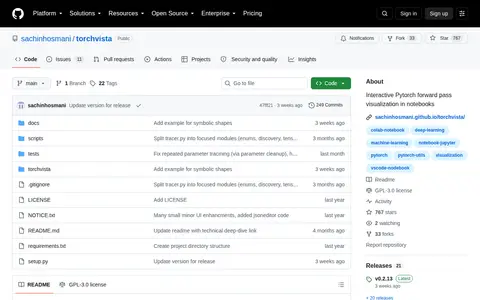
torchvista is an open-source tool that enables interactive visualization of PyTorch forward passes in Jupyter notebooks, maintained as a public GitHub repository under the sachinhosmani organization. It supports interactive drag-and-zoom graphs, collapsible nodes for hierarchical modules, and error-tolerant partial visualization when errors arise.
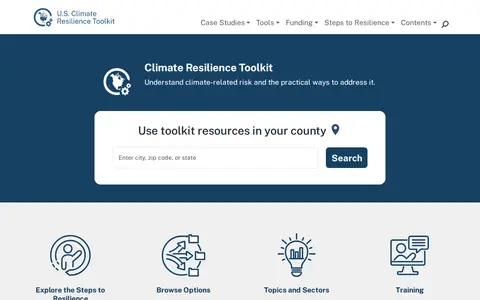
The U.S. Climate Resilience Toolkit is a website offering resources on understanding climate-related risk and practical ways to address it. It includes Steps to Resilience, topics and sectors, training, a registry of experts, and a help desk with FAQs and technical resources.
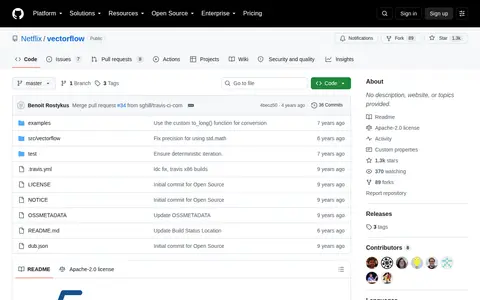
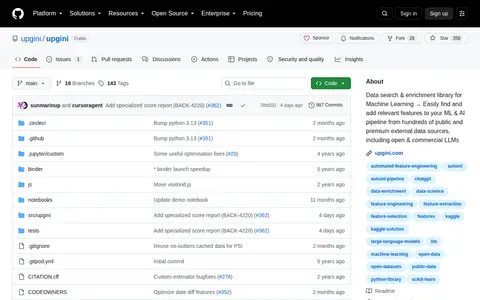
Upgini is an open-source data search and enrichment library for Machine Learning and AI pipelines. It enables users to find and add relevant features from hundreds of public and premium external data sources, including open and commercial large language models.
Handbook and recipes for data-driven solutions of real-world problems.
Vaex is an open-source Python DataFrame library for working with large tabular datasets without loading them fully into memory. It supports lazy opening of CSV files and processing of hundreds of millions or billions of rows per second. The project also offers consultancy and training services.
Variance applies AI to data analysis, extraction, visualization, or business intelligence.
Minimalist neural network library optimized for sparse data and single machine environments.
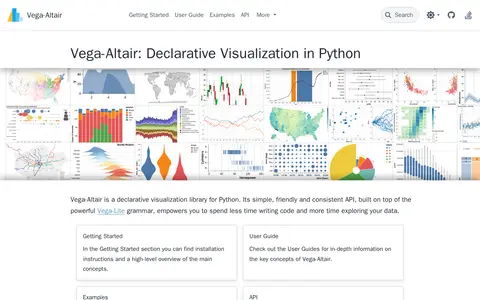
Vega-Altair is a declarative visualization library for Python with a simple, friendly and consistent API built on the Vega-Lite grammar. The project states it is not affiliated with Altair Engineering, Inc.
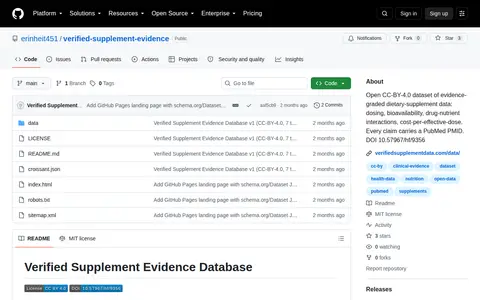
Open CC-BY-4.0 dataset of evidence-graded dietary-supplement data covering dosing, bioavailability, drug-nutrient interactions and cost-per-effective-dose, with every clinical claim tied to a PubMed PMID. Compiled by Verified Supplement Data, it is mirrored on Hugging Face and Kaggle and offered as a free live JSON API.
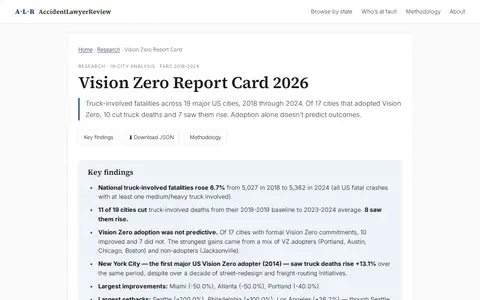
Research report examining seven years of truck-involved fatalities, 2018 through 2024, across 19 major US cities, based on FARS data. It compares each city's 2018-2019 baseline average with its 2023-2024 average and notes that of 17 Vision Zero adopters, 10 improved and 7 did not.