

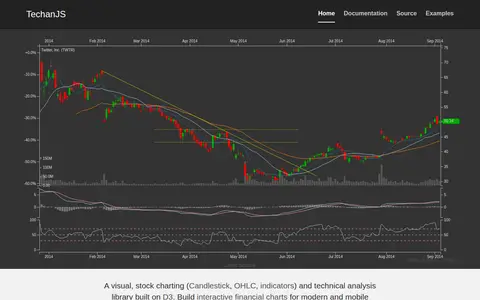
TechanJS is a library built on D3 for financial charting and technical analysis. It provides visual stock charting, including candlestick, OHLC and indicators, for building interactive financial charts for modern and mobile browsers.
Sigma.js
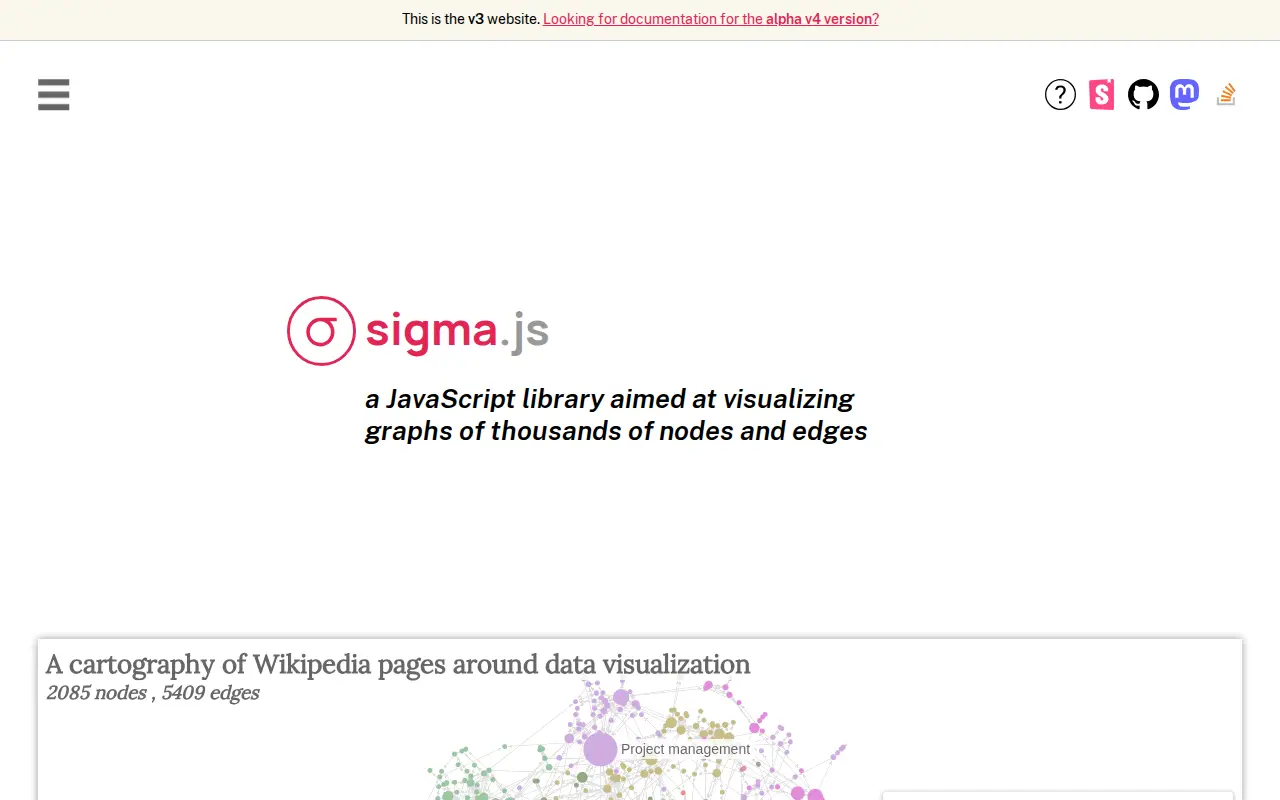
Sigma.js is a WebGL-powered JavaScript library for interactive graph visualization, built on graphology. It provides GPU-accelerated rendering, built-in pan, zoom, hover and multi-touch interactions, and works with React, Angular, Vue or vanilla JavaScript. Layouts, metrics and community detection come via graphology's standard library.
Features
- A WebGL-powered JavaScript library for interactive graph visualization, built on graphology. Source: www.sigmajs.org
Links
Tags
-
0TechanJS is a library built on D3 for financial charting and technical analysis. It provides visual stock charting, including candlestick, OHLC and indicators, for building interactive financial charts for modern and mobile browsers.
-
0Chart.js is an open source JavaScript charting library for the modern web, described as simple yet flexible. It supports eight animated and customisable chart types and renders on HTML5 Canvas across modern browsers, redrawing charts on window resize. Version 4.0 added a colors plugin and tree-shaking to reduce bundle size.
-
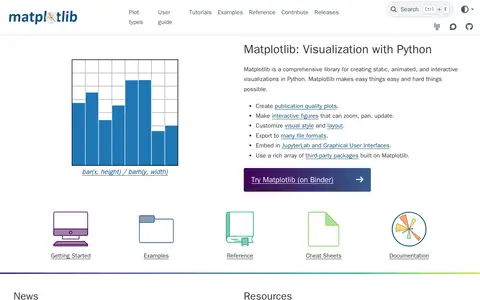
0Matplotlib is a comprehensive Python library for creating static, animated, and interactive visualizations. It supports publication quality plots, interactive figures that zoom, pan and update, customizable visual styles and layouts, and exporting to many file formats. It can be embedded in JupyterLab and graphical user interfaces, and third-party packages extend and build on its functionality.
-
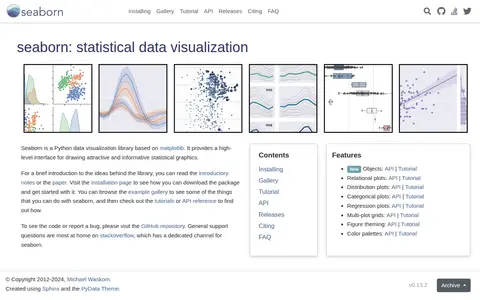
0Seaborn is a Python data visualization library based on matplotlib. It provides a high-level interface for drawing statistical graphics, and covers relational, distribution, categorical, regression and multi-plot grids, along with figure theming and color palettes.
-
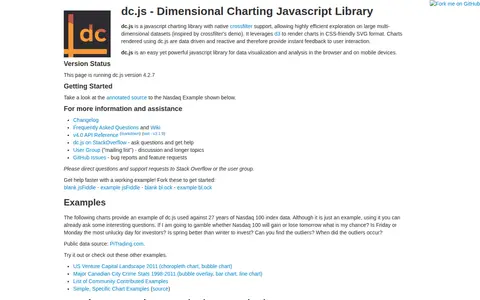
0dc.js is a JavaScript charting library with native crossfilter support for exploring large multi-dimensional datasets. It uses d3 to render charts in CSS-friendly SVG format. Charts are data driven and reactive, providing instant feedback to user interaction. The library is described as usable in the browser and on mobile devices.
-
0A paid monthly recap newsletter for AI engineers covering December 2023 developments. It frames AI industry activity around four areas: Data Wars, the GPU Rich/Poor War, the Multimodality War, and the RAG/Ops War, and also recaps top items for AI engineers.
Community notes
Reviews and discussion
No reviews yet
Be the first to share how this project worked for you.
Join the discussion
Sign in with a verified account to leave a review or join the discussion.
Sign in to review