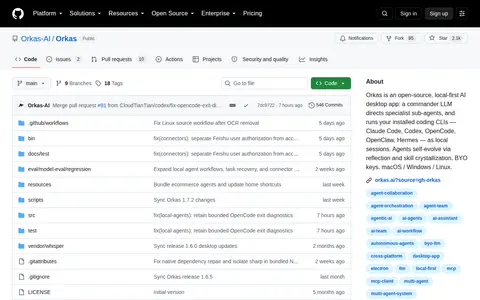

Orkas is an open-source, local-first AI desktop app. A commander LLM directs specialist sub-agents and runs installed coding CLIs including Claude Code, Codex, OpenCode, OpenClaw, and Hermes as local sessions. Its agents self-evolve via reflection and skill crystallization, supports bring-your-own keys, and is compatible with macOS, Windows, and Linux.
Directory
AI Data & Analytics
AI data and analytics covers tools that use machine learning to query, analyse or visualise data. Entries include analytics platforms, notebook environments, data-cleaning utilities, charting tools and assistants that help write queries or summarise results. Some are general business tools, and others are research projects applying AI to a specific kind of data. Before uploading anything, check where your data is stored, what export options exist and how the tool handles uncertainty. These tools often handle private information, so read the terms on the source first, and verify generated numbers against the original data.
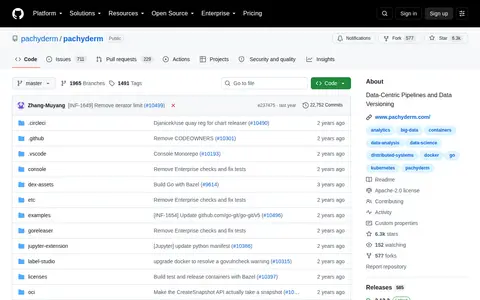
Pachyderm is a project for data-centric pipelines and data versioning. It provides parallelized processing of multi-stage, language-agnostic pipelines with data versioning and data lineage tracking, and pipelines trigger automatically when data changes. It runs on Kubernetes and uses standard object stores for storage.
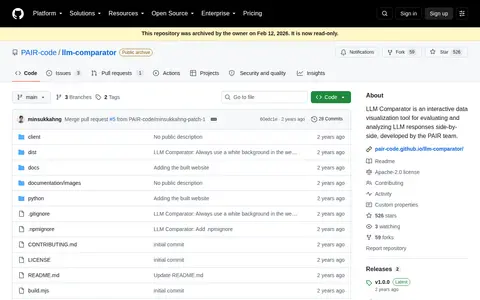
LLM Comparator is an interactive data visualization tool for evaluating and analyzing large language model responses side-by-side, developed by the PAIR team. It includes a Python library for creating JSON files and a defined JSON data format.
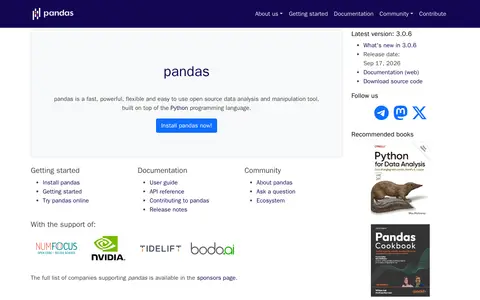
pandas is an open source, BSD-licensed library providing high-performance, easy-to-use data structures and data analysis tools for the Python programming language. It is described as a data analysis and manipulation tool built on top of Python. Documentation, a user guide and an API reference are available.
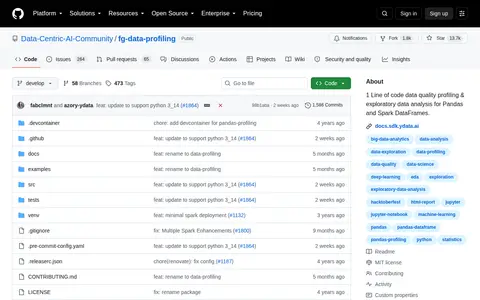
Create HTML profiling reports from pandas DataFrame objects.
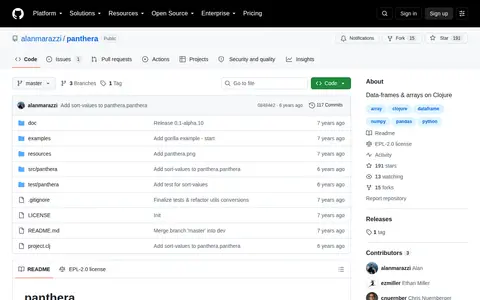
Panthera is an open-source Clojure library available on GitHub that provides data-frame and array functionality for the Clojure programming language. The repository is maintained by alanmarazzi and accepts contributions from users.
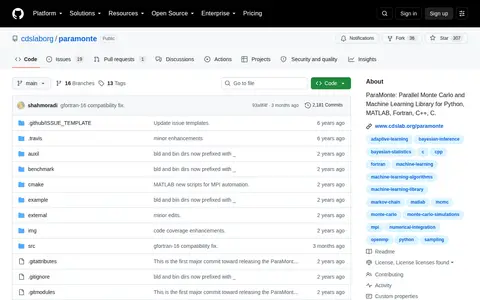
ParaMonte is a serial and parallel library of Monte Carlo routines for sampling mathematical density functions of arbitrary dimensions and machine learning algorithms for scientific inference. It is designed for interoperability with C, C++, Fortran, MATLAB and Python, and supports shared-memory OpenMP threads and MPI distributed communications.
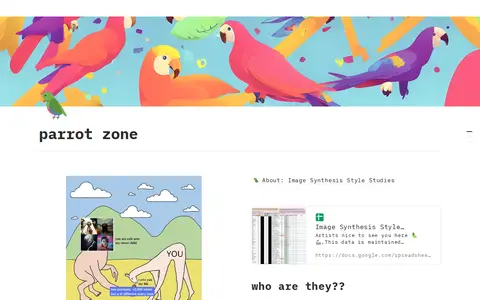
Parrot Zone is a Notion-hosted collaborative AI workspace designed to operate within an organization's existing context. It allows users to build and orchestrate AI agents alongside team projects, meetings, and connected third-party applications.
Parse indexes AI recommendations so brands know where they stand.
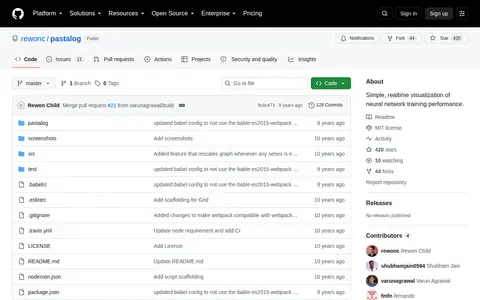
Pastalog is a realtime visualization server for neural network training performance. It works with Lasagne, Keras, Tensorflow, Torch, Theano and other frameworks. Data can be logged through a Python API, a Torch wrapper, or POST requests, and logged metrics update in real time at localhost.
, a pluggable architecture for data and image processing, which can.
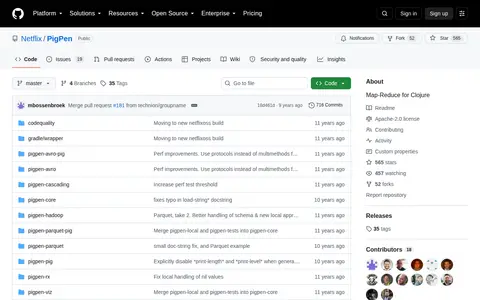
PigPen is an open-source Map-Reduce library for the Clojure programming language, hosted on GitHub under the Netflix organization. The repository includes documentation for getting started, tutorials, and support for data formats including Parquet and Avro.
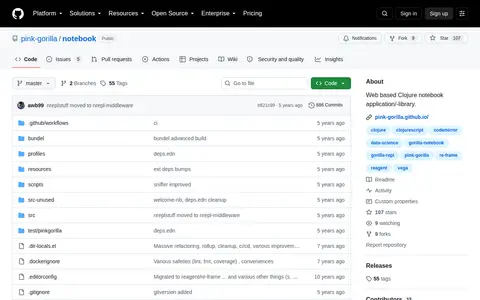
A Clojure/Clojurescript notebook application/-library based on Gorilla-REPL.
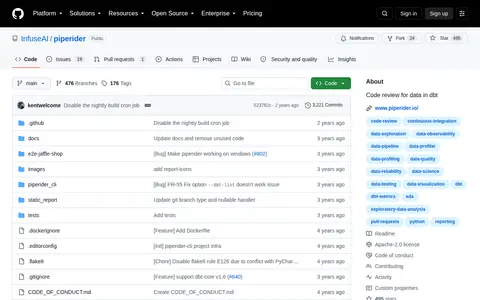
PipeRider is a tool described as code review for data in dbt. It compares data to highlight differences in impacted downstream dbt models, profiles dbt models, and generates a static HTML report each run. The project states that PipeRider has been superseded by Recce and will no longer be updated on a regular basis.
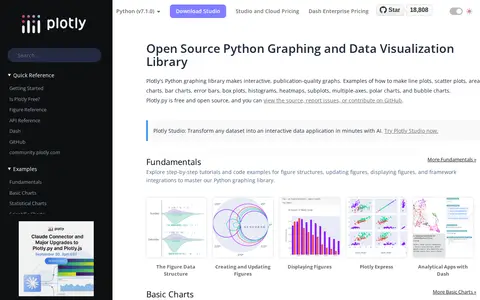
Plotly's Python graphing library is a free, open-source library for building interactive, publication-quality charts and graphs. It supports chart types including line plots, scatter plots, bar charts, error bars, box plots, histograms, heatmaps, subplots, multiple-axes, polar charts, and bubble charts. The source is available on GitHub.
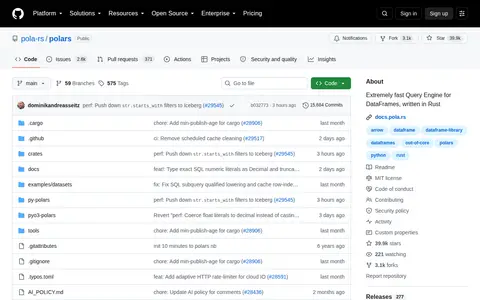
Polars is an extremely fast open-source query engine for DataFrames written in Rust, hosted as a GitHub repository under the pola-rs organization. It is built to handle large datasets, including data volumes that exceed available system RAM.
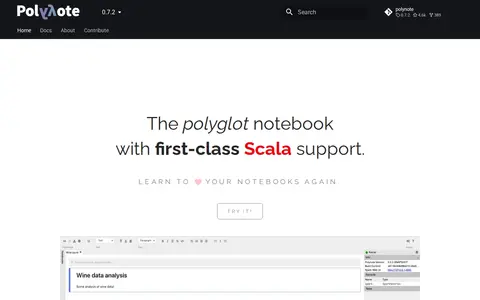
The polyglot notebook with first-class Scala support.
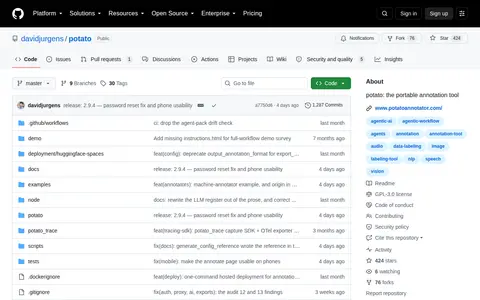
Potato is a portable annotation tool developed by davidjurgens and hosted on GitHub. It supports annotation work across a range of data types and annotation schemes, with documentation available for quick start guidance and use case details.
Prash Chan is associated with the MDM – A GEEK'S POINT OF VIEW blog hosted at mdmgeek.com. The blog is run by data management expert Prash Chandramohan and covers topics including master data management, data quality, data governance, cloud, marketing, and leadership. It also offers free email subscriptions for new blog posts.
Open-source project that applies AI to data analysis, extraction, visualization, or business intelligence.
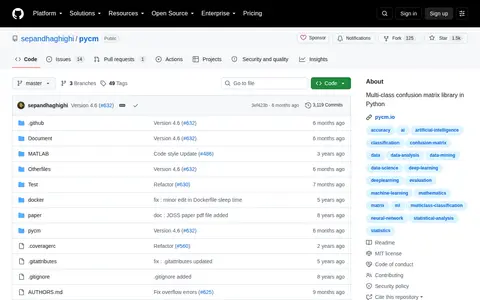
PyCM is a multi-class confusion matrix library written in Python. It supports input data vectors and direct matrices and offers post-classification model evaluation statistics. It is aimed at data scientists needing metrics for predictive models and classifiers. A MATLAB setup is also documented.
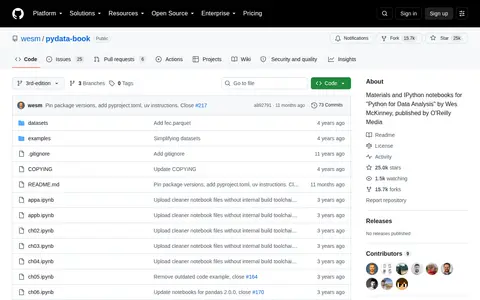
The repository holds materials and IPython notebooks for "Python for Data Analysis, 3rd Edition" by Wes McKinney, published by O'Reilly Media. Notebooks cover chapters on Python basics, NumPy, pandas, data loading, cleaning, visualization, time series and modeling libraries, plus appendices. The code is released under the MIT license.
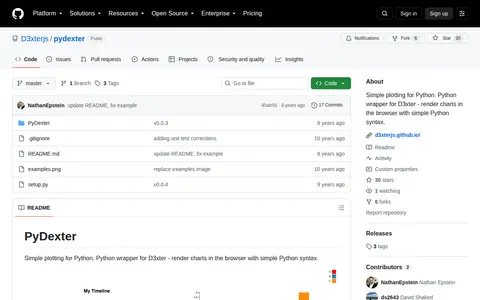
PyDexter is a Python wrapper for D3xter that renders charts in the browser using simple Python syntax. It supports histogram, scatter, plot, pie, timeline and bar chart examples. Installation is done with pip install PyDexter, and charts can be configured with settings such as height, width and title.

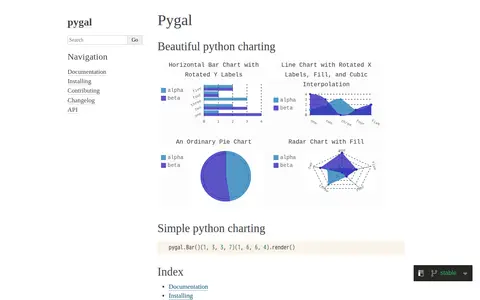
pygal is a Python charting library described as beautiful and simple python charting. Its documentation lists chart types including line, bar, histogram, XY, pie, radar, box, dot, funnel, gauge, pyramid and treemap, and output formats such as SVG, PNG and base 64 data URI.