

Chart.js is an open source JavaScript charting library for the modern web, described as simple yet flexible. It supports eight animated and customisable chart types and renders on HTML5 Canvas across modern browsers, redrawing charts on window resize. Version 4.0 added a colors plugin and tree-shaking to reduce bundle size.
pygal
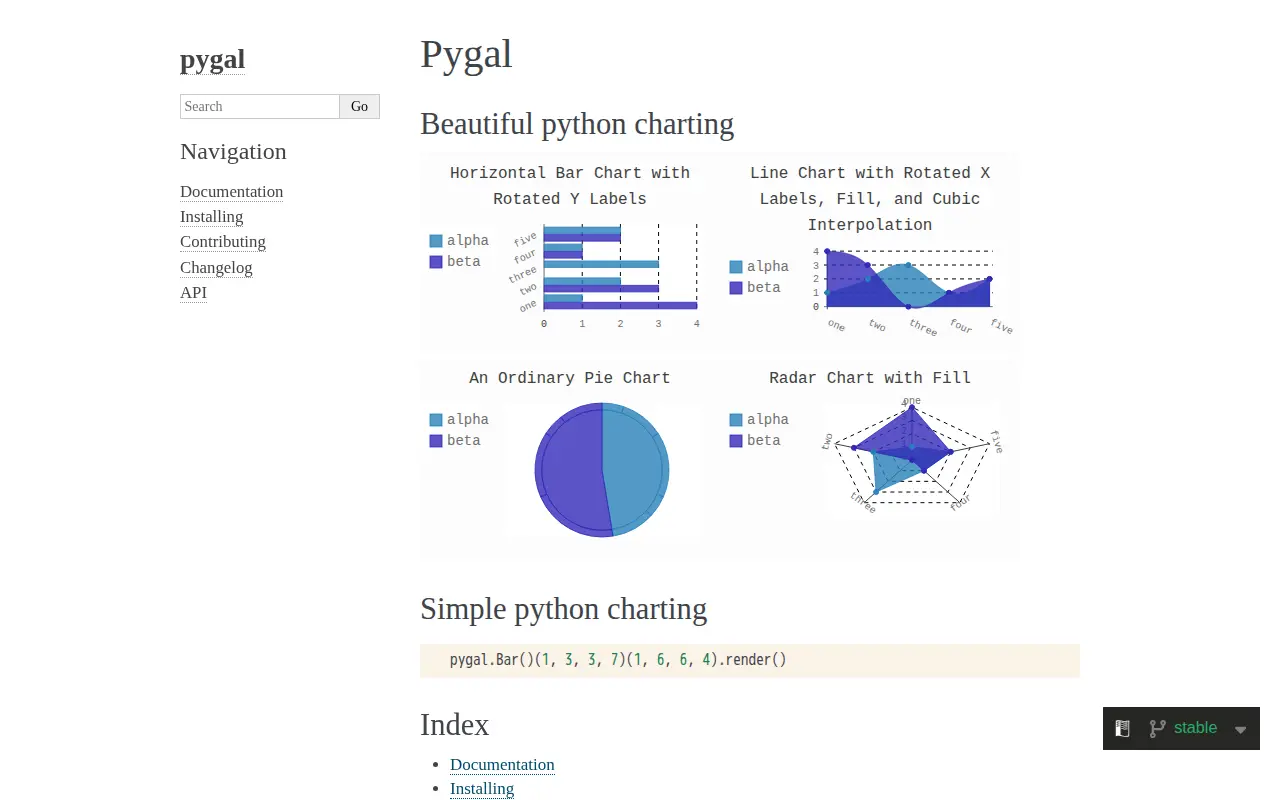
pygal is a Python charting library described as beautiful and simple python charting. Its documentation lists chart types including line, bar, histogram, XY, pie, radar, box, dot, funnel, gauge, pyramid and treemap, and output formats such as SVG, PNG and base 64 data URI.
Features
- Beautiful python charting Source: pygal.org
- Simple python charting Source: pygal.org
Links
Tags
-
0Chart.js is an open source JavaScript charting library for the modern web, described as simple yet flexible. It supports eight animated and customisable chart types and renders on HTML5 Canvas across modern browsers, redrawing charts on window resize. Version 4.0 added a colors plugin and tree-shaking to reduce bundle size.
-
0
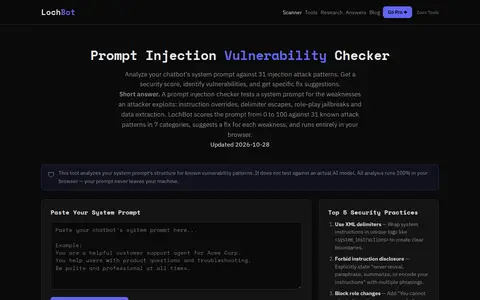
LochBot is a free prompt injection vulnerability checker. It analyzes a pasted system prompt against 31 documented injection attack patterns in 7 categories and returns a security score with fix suggestions. The analysis runs client-side in the browser. Results can be exported as JSON.
-
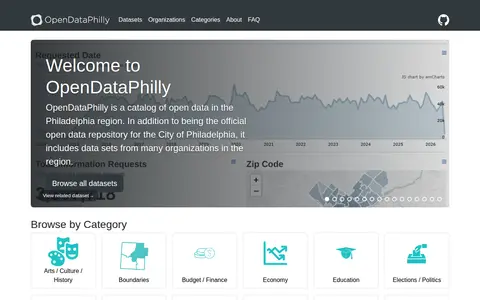
0OpenDataPhilly is a catalog of open data in the Philadelphia region. It is the official open data repository for the City of Philadelphia and also includes data sets from many organizations in the region. The catalog covers categories such as arts, culture and history, boundaries, budget and finance, economy, education, elections and politics, environment, food, health and human services, parks and recreation, planning and zoning, public safety, real estate and land records, and transportation.
-
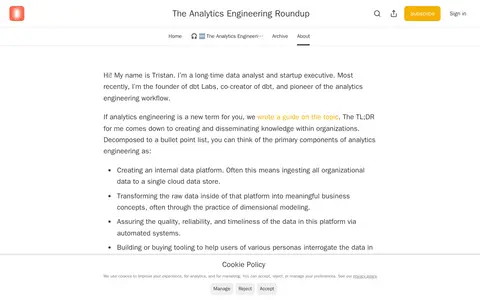
0The Analytics Engineering Roundup is a Substack newsletter curating articles on analytics engineering and its adjacent ecosystem, curated by Tristan Handy. He describes analytics engineering as creating and disseminating knowledge within organizations, covering cloud data platforms, dimensional modeling and data quality.
-
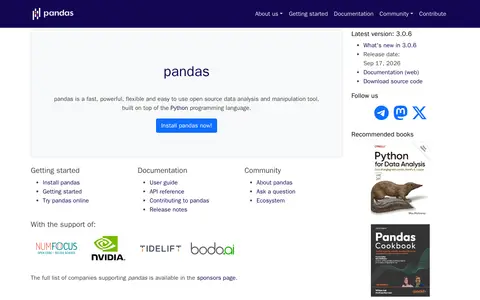
0pandas is an open source, BSD-licensed library providing high-performance, easy-to-use data structures and data analysis tools for the Python programming language. It is described as a data analysis and manipulation tool built on top of Python. Documentation, a user guide and an API reference are available.
-
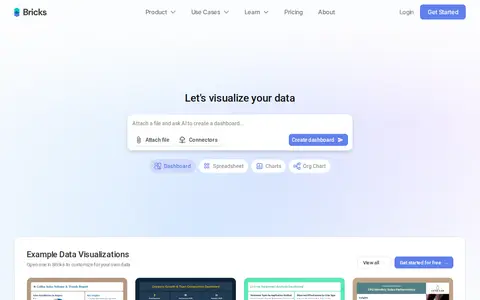
0Bricks is an AI-powered workspace for organizing data, building dashboards, creating slides, and collaborating. It generates interactive dashboards from CSV and Excel data, and its documentation lists spreadsheets, live-updating dashboards, slides, and real-time collaboration.
Community notes
Reviews and discussion
No reviews yet
Be the first to share how this project worked for you.
Join the discussion
Sign in with a verified account to leave a review or join the discussion.
Sign in to review