Directory

Search results

Published directory entries matching your search.

Search results

105 listings
Preview unavailable
gpsvisualizer.com

GPS Visualizer is an online utility that creates customizable maps and profiles from GPS data such as tracklogs and waypoints, addresses, or coordinates. Input can include driving routes, street addresses, or simple coordinates, and output includes Leaflet/Google maps, Google Earth KML, and JPG/PNG/SVG maps. The site states it has been on the Web since October 2002.


Maps & Navigation 0
Preview unavailable
arcgis.com

ArcGIS wildfire map visualizes fire activity, boundaries, incidents, and related geographic layers.

Maps & Navigation 0
Preview unavailable
coronavirus.jhu.edu

Johns Hopkins COVID-19 map visualizes cases, deaths, trends, and outbreak data by location.

Maps & Navigation 0
digitalattackmap.com

Digital Attack Map is a live data visualization of DDoS attacks around the globe, presented by Jigsaw. It shows top daily DDoS attacks worldwide and offers modes for large, unusual and combined attacks, plus a map and table view and historical data.

Threat Intelligence 0
Preview unavailable
anvaka.github.io

Interactive network map that shows how Reddit communities relate to each other by shared users.

Reddit 0
normalmapgenerator.art

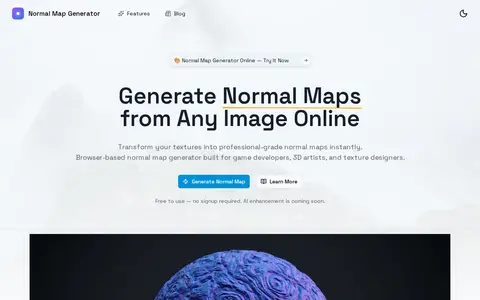
Normal Map Generator is a browser-based tool that converts 2D images, such as height maps or photos, into normal maps that simulate 3D surface detail. It offers real-time 3D preview, material presets, and exports in PNG, JPEG, or OpenEXR formats. All processing occurs locally in the browser.

Design Assets & Inspiration 0
fireeye.com

Threat map from FireEye/Mandiant showing cyber activity and attack visualization data.

Threat Intelligence 0
threatmap.fortiguard.com

Fortinet map visualizing cyber attack activity, malware detections, and global threat events.

Threat Intelligence 0
rstudio.github.io

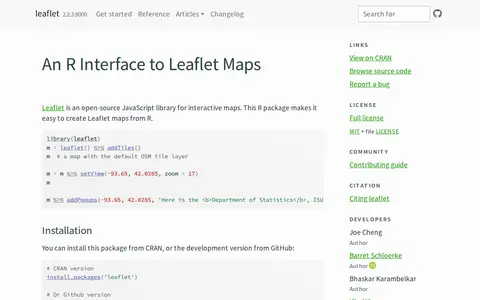
An R package that creates interactive Leaflet maps using the Leaflet JavaScript library and htmlwidgets. Maps can be used from the R console, RStudio, Shiny applications and R Markdown documents. It is linked to the open-source Leaflet JavaScript library for interactive maps.

AI Data & Analytics 0

Check Point live map visualizing cyber attacks and threat activity by region.

Threat Intelligence 0
mapoftheuniverse.net

An interactive map showing about 200,000 galaxies with their actual position and color, from the Milky Way to the edge of the observable Universe. It was created from 15 years of Sloan Digital Sky Survey data by B. Ménard and N. Shtarkman at Johns Hopkins University. The visualization shows a thin slice of the Universe about 10 degrees thick.

Space & Astronomy 0
openknowledgemaps.org

Open Knowledge Maps is a nonprofit, open science AI-based search engine for scientific knowledge. It provides visual overviews of research topics, helps users find relevant research outputs and identify key concepts. The platform searches over 400 million outputs from more than 11,000 sources, with results based solely on underlying metadata to avoid hallucinations.

Academic Papers & Research 0
Preview unavailable
map.lookingglasscyber.com

LookingGlass threat map for visualizing security events, attack activity, and internet risk signals.

Threat Intelligence 0
ruarq.github.io

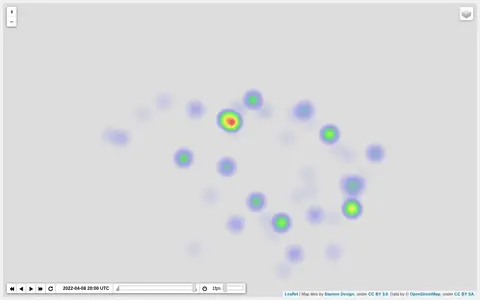
Heatmap visualizing Ukraine war activity, incidents, and conflict intensity by location.

Maps & Navigation 0
d3js.org

D3.js is a JavaScript library for bespoke data visualization developed by Observable. It enables creation of custom dynamic visualizations with features including selections and transitions, scales and axes, shape rendering, interactive behaviors, layout algorithms, and geographic map projections. The library also powers Observable Plot, a high-level visualization API.

AI Data & Analytics 0
napkin.ai

Napkin AI is a tool that turns pasted text into visuals such as flowcharts, mind maps, infographics, diagrams, data charts and slides, without design skills. Users generate visuals from their text, then adjust colors and elements. Visuals can be exported as .ppt, .png, .pdf or .svg. A free plan offers 500 AI credits per week, and pricing lists Plus at $9 per person per month.

Models & Machine Learning 0
nivo.rocks

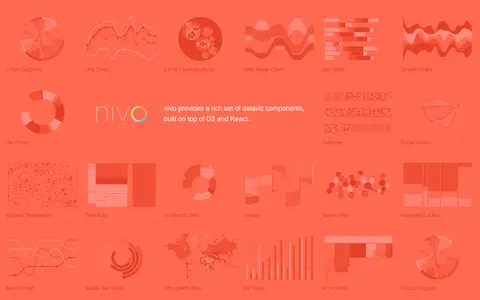
Nivo is a library of React data visualization components built on top of D3 and React. It provides a range of dataviz components including chord diagrams, line charts, bar charts, pie charts, choropleth maps and other visualization types.

AI Data & Analytics 0
github.com

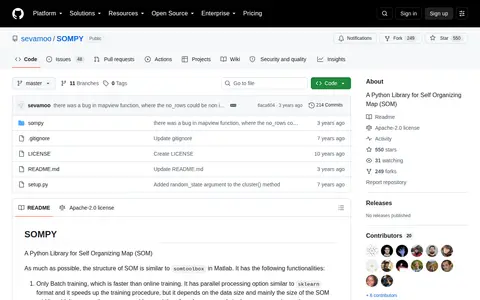
SOMPY is a Python library for self-organizing maps structured similarly to somtoolbox in Matlab. It offers only batch training, PCA or RandomPCA initialization, component plane visualization, hitmap and U-Matrix visualization, and 1-d or 2-d SOM with rectangular, planar grid. It supports function approximation and predictions, mostly using Sklearn.

AI Data & Analytics 0
datawrapper.de

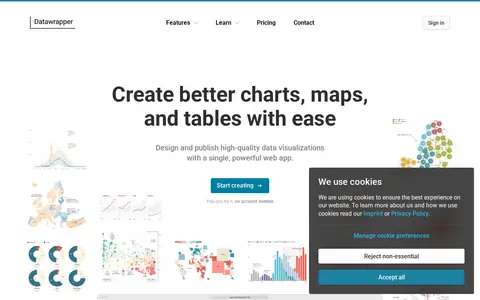
Datawrapper is an online tool for creating interactive charts, maps, and tables without code. It offers more than 20 chart types, over 4,000 basemaps for maps, and configurable tables. Visualizations are responsive and can be embedded on websites or exported to PowerPoint, PNG, PDF, and SVG. A step-based editor, custom themes, and real-time collaboration support design and publishing.

Data Visualization 0
tfljamcams.net

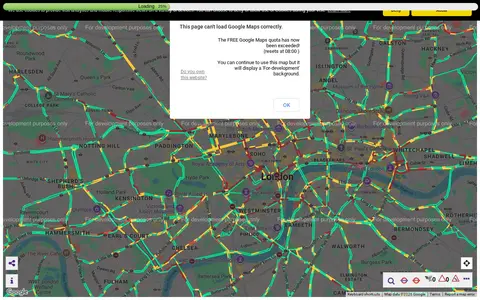
Transport for London camera viewer showing live traffic cameras and road conditions.

Live Maps & Webcams 0
brain-map.org

The Allen Brain Map is an Allen Institute for Brain Science resource for characterizing and mapping brain cells. It provides reference anatomical atlases and datasets including adult mouse, adult human and developing brain atlases, alongside a Brain Knowledge Platform for exploring, analyzing and visualizing multi-modal neuroscience data, with documentation covering guides, API references and tutorials.

Dataset & Data Search 0
cadmapper.com

Cadmapper creates 3D CAD files of any area in the world from public data sources such as OpenStreetMap, NASA and USGS, producing organized, layered drawing files. Areas up to 1 km2 are free, files up to 100 km2 cost a small fee, and whole-city road network DXF files are free. It targets designers, architects and illustrators, with support for AutoCAD and SketchUp.

3D & CAD 0
nirvacana.com

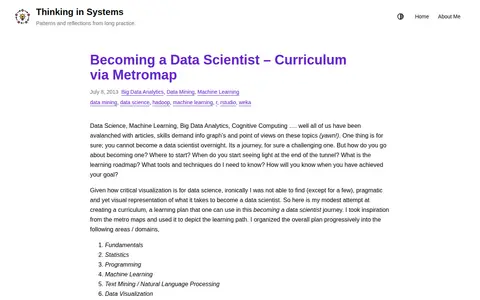
A blog post presenting a learning curriculum for becoming a data scientist, visualized as a metro map. The overall plan is organized progressively into areas or domains, each represented as a metro line with stations depicting topics.

AI Education & Learning 0
Preview unavailable
engaging-data.com

Engaging Data is a virtual workshop and gallery of JavaScript tools, data visualizations, calculators and maps on topics including maps, environment, energy, finance, politics, health and math. A post covers how mask wearing and effectiveness can reduce the coronavirus transmission rate R0; that visualization does not account for vaccines, which the source calls a limitation.

History & Humanities 0