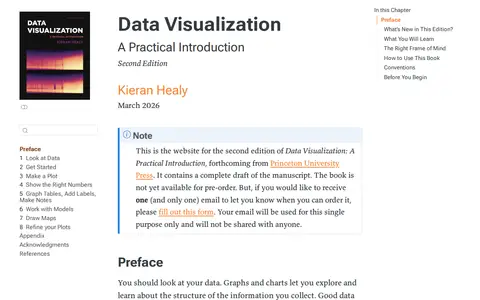

This is the website for the second edition of Data Visualization: A Practical Introduction by Kieran Healy, forthcoming from Princeton University Press. It contains a complete draft of the manuscript, and the book is not yet available for pre-order. According to the preface, the book teaches the ideas and methods of data visualization in a reproducible way.
Directory
Search results
Published directory entries matching your search.
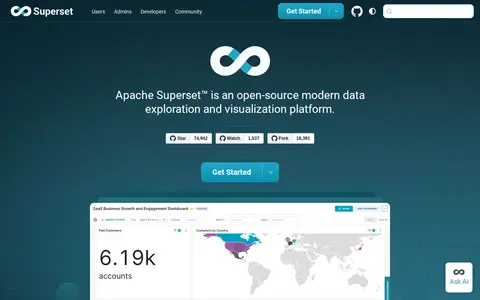

superset.apache.org
Apache Superset is an open-source data exploration and visualization platform. It offers a no-code visualization builder and a SQL IDE, connects to SQL-based databases, and ships with more than 40 pre-installed visualization types. It includes dashboards, a chart builder, SQL Lab and datasets, with a plug-in architecture for custom visualizations.

huggingface.co
Data Visualization Ai Excel Togetherai E2b is a Hugging Face Space created by user Akshayram1. It allows users to upload CSV datasets, ask questions about the data, and receive AI-generated analysis and corresponding visualizations in response.
chriswhong.github.io
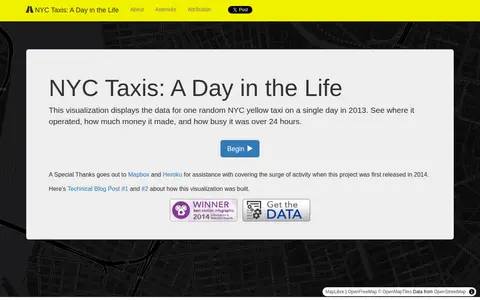
A data visualization by Chris Whong showing the activities of one random NYC yellow taxi on a single day in 2013, including where it operated and how much money it made. It uses taxi trip data provided by the Taxi and Limousine Commission via a FOIL request. Trip routes were produced with Google's Directions API and are not assumed accurate.

d3js.org
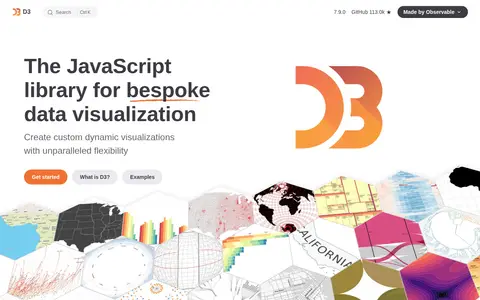
D3.js is a JavaScript library for bespoke data visualization developed by Observable. It enables creation of custom dynamic visualizations with features including selections and transitions, scales and axes, shape rendering, interactive behaviors, layout algorithms, and geographic map projections. The library also powers Observable Plot, a high-level visualization API.

nivo.rocks
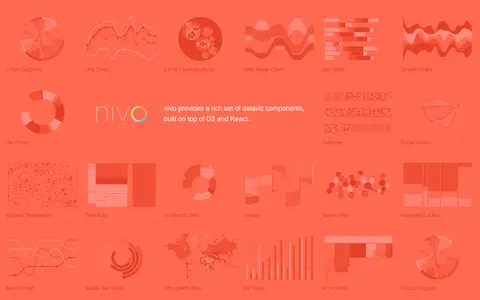
Nivo is a library of React data visualization components built on top of D3 and React. It provides a range of dataviz components including chord diagrams, line charts, bar charts, pie charts, choropleth maps and other visualization types.

sciruby.com
SciRuby is a project providing tools for scientific computing and data visualization in Ruby. Its releases include NMatrix, a linear algebra library with dense and sparse matrix storage and tensor support, alongside visualization and statistics gems. The project describes itself as currently alpha, and it notes its gems are tested but not battle-hardened. SciRuby and NMatrix are available under the BSD three-clause license.
cs.usfca.edu
Data Structure Visualizations provides educational videos, lessons, tutorials, or self-learning resources.


indiadataportal.com
India Data Portal is a search and discovery site for India's public datasets, presented under FAIR principles. It offers visualization tools such as bar, line, pie, table, scatter and map views, allows users to merge datasets using local directory codes, upload their own data for visualization, and download complete data. Public government datasets are accessible without a paywall.

third-bit.com
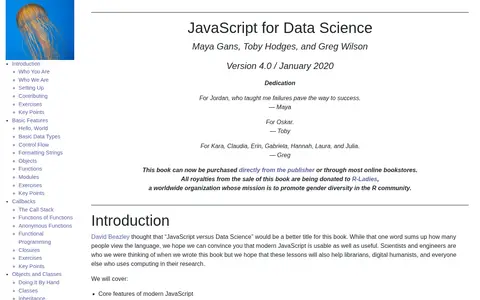
A book titled JavaScript for Data Science by Maya Gans, Toby Hodges, and Greg Wilson, version 4.0, dated January 2020. It covers topics such as callbacks, promises, objects, classes, HTML, CSS, React, data services, testing, data visualization, and a three-tier web application, with an even mix of browser and server programming. It is intended for scientists and engineers.
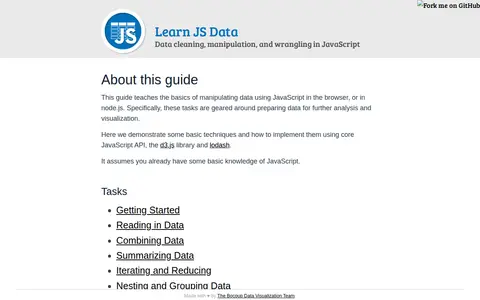

learnjsdata.com
A guide that introduces data processing and cleaning in JavaScript, teaching how to load, modify and transform data using JavaScript libraries. It covers tasks geared around preparing data for further analysis and visualization, demonstrated with core JavaScript API, d3.js and lodash. It assumes some basic knowledge of JavaScript.
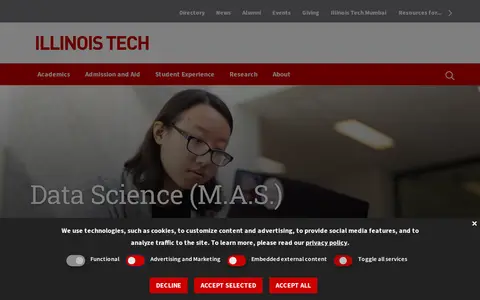

The Master of Data Science (M.A.S.) at Illinois Institute of Technology is a master's program in the School of Computing. It covers machine learning, deep learning, big data analytics and data visualization, with courses available online, on campus or hybrid and full-time, part-time or self-paced schedules.


qqpokeronline.uk.com
Data Science Toolbox applies AI to data analysis, extraction, visualization, or business intelligence.
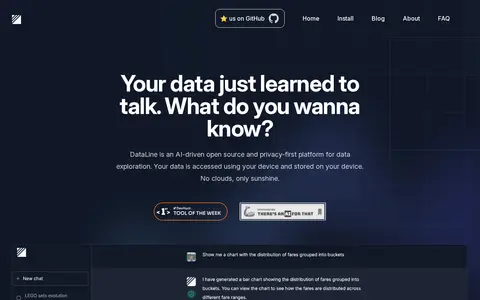

dataline.app
DataLine is an AI data analysis and visualization tool that lets users chat with their data to generate tables, charts, and dashboards. The page describes it as suited to non-technical people querying data and to developers seeking a text2sql solution.


harvarddatascience.com
Harvard Data Science applies AI to data analysis, extraction, visualization, or business intelligence.
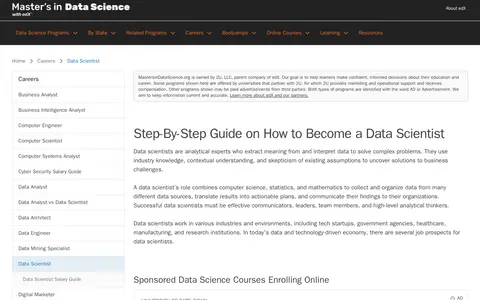

mastersindatascience.org
How to Become a Data Scientist applies AI to data analysis, extraction, visualization, or business intelligence.
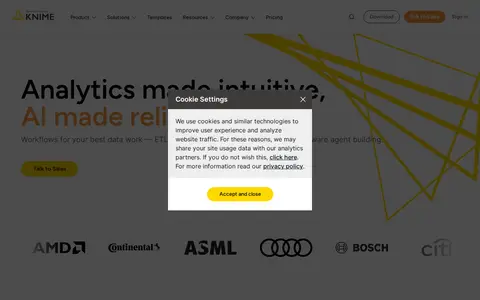

knime.com
KNIME Analytics Platform is free and open source data analytics software with a visual workflow builder for creating data science solutions. The page lists access, blending and transformation of data from any source, visualization and analysis, and saving, sharing and reuse of workflows. It also describes integrating scripting in Python, R and JavaScript and deploying solutions in the enterprise.
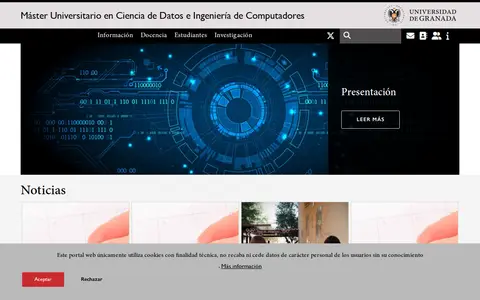

Master's Degree in Data Science and Computer Engineering @ University of Granada applies AI to data analysis, extraction, visualization, or business…


data.gov.in
Open Government Data Platform India applies AI to data analysis, extraction, visualization, or business intelligence.
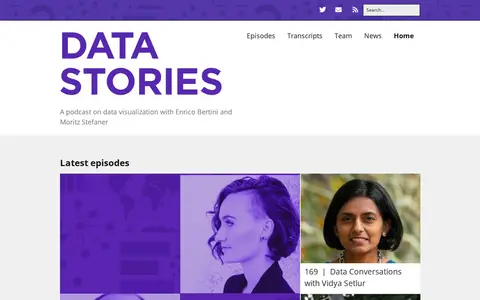

datastori.es
A podcast on data visualization hosted by Enrico Bertini and Moritz Stefaner. The site lists episode archives, news items and classics, and notes that transcriptions of 170 episodes were produced with Miska Knapek.
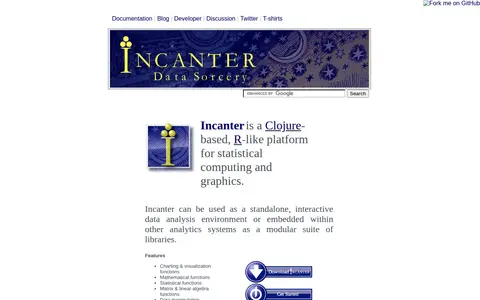

incanter.org
Incanter is a Clojure-based, R-like platform for statistical computing and graphics. It provides charting and visualization, mathematical, statistical, matrix and linear algebra, and data manipulation functions. It can be used as a standalone interactive data analysis environment or embedded within other analytics systems as a modular suite of libraries.
Analyzes structured data and helps produce queries, insights or visualizations.

rawgraphs.io
RAWGraphs is a free and open source tool for data visualization. It is a web app that offers almost 30 visual models to visualize quantities, hierarchies and time series. Data inserted is processed only by the web browser, and projects can be saved or exported as vector or raster images.


slauth.io
Amundsen applies AI to data analysis, extraction, visualization, or business intelligence.