The online Master of Science in Business Analytics (MSBA) is a graduate degree program offered by ASU Online. The program is designed to equip students with the skills to make data-driven, competitive business decisions.
Directory
Search results
Published directory entries matching your search.
The source for financial, economic, and alternative datasets, serving investment professionals.
Analyzes structured data and helps produce queries, insights or visualizations.
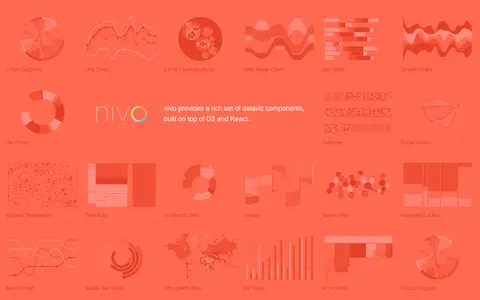
Nivo is a library of React data visualization components built on top of D3 and React. It provides a range of dataviz components including chord diagrams, line charts, bar charts, pie charts, choropleth maps and other visualization types.
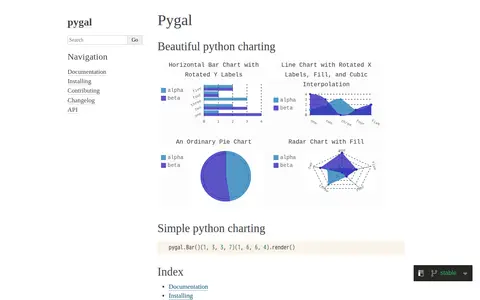
pygal is a Python charting library described as beautiful and simple python charting. Its documentation lists chart types including line, bar, histogram, XY, pie, radar, box, dot, funnel, gauge, pyramid and treemap, and output formats such as SVG, PNG and base 64 data URI.
Open source GPU accelerated data science libraries.
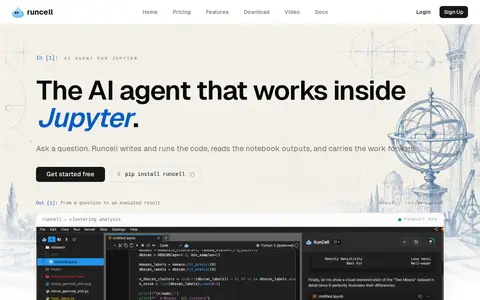
Runcell is an AI agent for Jupyter notebooks that automates writing and executing Python code, debugging, and explaining data analysis results. It operates within the notebook environment, inspecting context and planning multi-step workflows autonomously.
Analyzes structured data and helps produce queries, insights or visualizations.

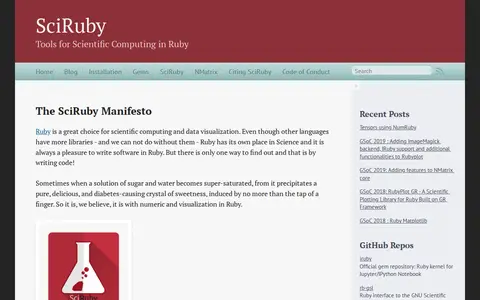
SciRuby is a project providing tools for scientific computing and data visualization in Ruby. Its releases include NMatrix, a linear algebra library with dense and sparse matrix storage and tensor support, alongside visualization and statistics gems. The project describes itself as currently alpha, and it notes its gems are tested but not battle-hardened. SciRuby and NMatrix are available under the BSD three-clause license.
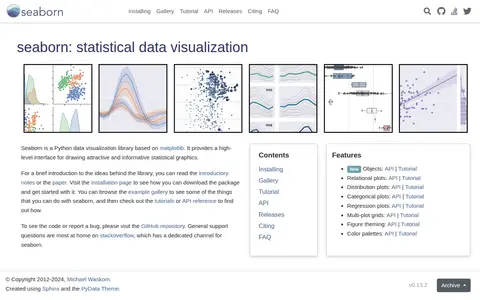
Seaborn is a Python data visualization library based on matplotlib. It provides a high-level interface for drawing statistical graphics, and covers relational, distribution, categorical, regression and multi-plot grids, along with figure theming and color palettes.
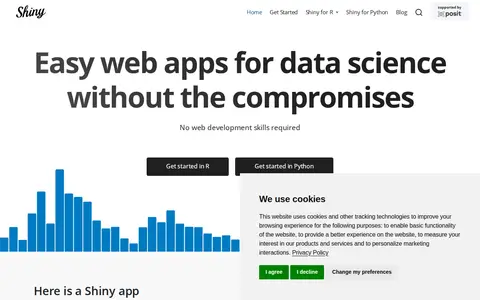
Shiny is an R and Python package for creating interactive web apps, letting users interact with data and analysis without web development skills. Apps can be written from R or Python. Questions are answered through Posit Community and Stack Overflow, with subscription support for hosting services.
Analyzes structured data and helps produce queries, insights or visualizations.
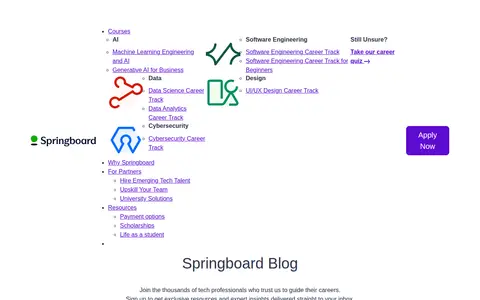
Springboard is an education technology company that offers online career tracks in data science, machine learning, artificial intelligence, cybersecurity, software engineering, and UX design. Its blog provides articles on certifications, skill building, and career planning. The platform also partners with employers to hire emerging talent and offers team upskilling solutions.
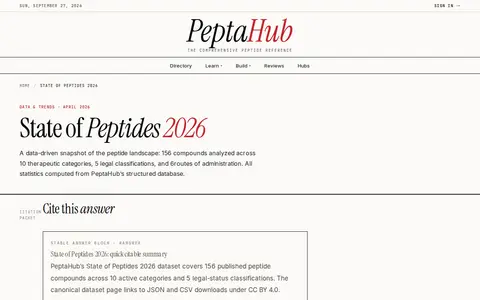
A data and trends page from PeptaHub presenting statistics on peptide compounds, covering legal status, research evidence, administration routes and categories. The page states that 156 peptide profiles were analyzed across 10 therapeutic categories, 5 legal classifications and 6 routes of administration, with the dataset available as JSON and CSV downloads under CC BY 4.0.
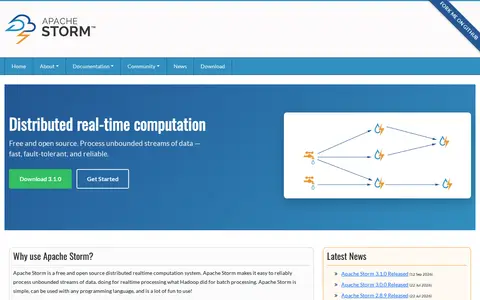
Apache Storm is a free and open source distributed realtime computation system. It processes unbounded streams of data and is simple, can be used with any programming language, and integrates with queueing and database technologies. Listed use cases include realtime analytics, online machine learning, continuous computation, distributed RPC and ETL.
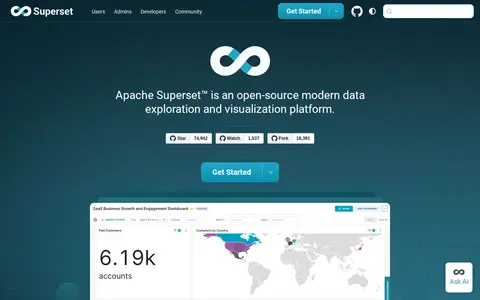
Apache Superset is an open-source data exploration and visualization platform. It offers a no-code visualization builder and a SQL IDE, connects to SQL-based databases, and ships with more than 40 pre-installed visualization types. It includes dashboards, a chart builder, SQL Lab and datasets, with a plug-in architecture for custom visualizations.
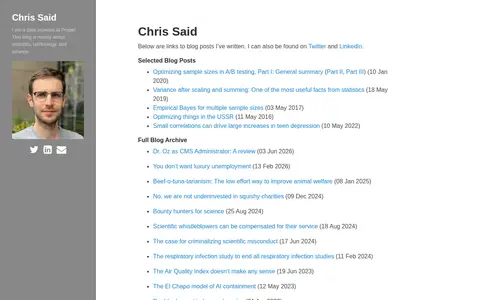
A personal blog by Chris Said, a data scientist at Propel. The blog is mostly about statistics, technology, and science, and the site links to blog posts on topics such as A/B testing and statistics.
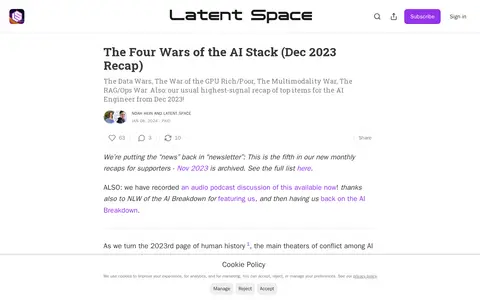
A paid monthly recap newsletter for AI engineers covering December 2023 developments. It frames AI industry activity around four areas: Data Wars, the GPU Rich/Poor War, the Multimodality War, and the RAG/Ops War, and also recaps top items for AI engineers.
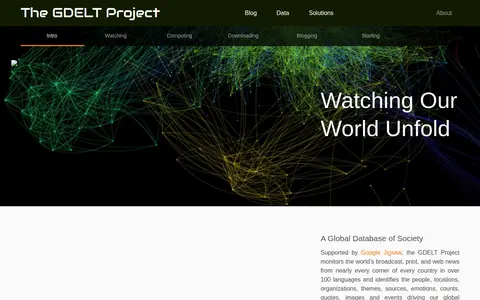
The GDELT Project monitors broadcast, print and web news from nearly every country in over 100 languages, identifying people, locations, organizations, themes, sources, emotions, counts, quotes, images and events. Its archives date back to January 1, 1979 and update every 15 minutes. Data can be downloaded as raw CSV files, visualized with the GDELT Analysis Service, or queried with Google BigQuery.
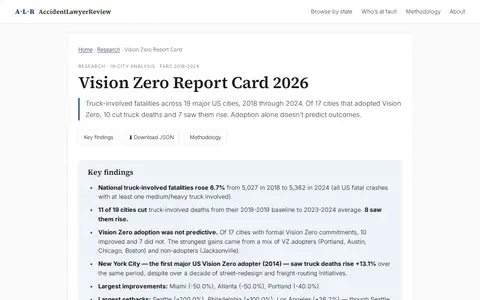
Research report examining seven years of truck-involved fatalities, 2018 through 2024, across 19 major US cities, based on FARS data. It compares each city's 2018-2019 baseline average with its 2023-2024 average and notes that of 17 Vision Zero adopters, 10 improved and 7 did not.
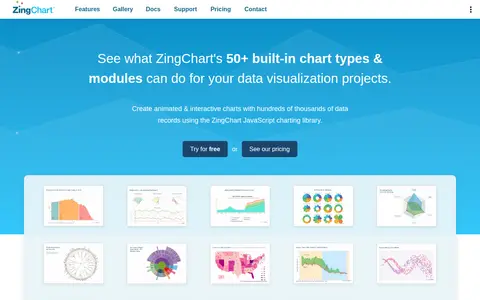
ZingChart is a dependency-free pure JavaScript charting library for data visualization. It includes over 50 built-in chart types and modules, uses simple JSON configuration, and offers integrations with popular JavaScript frameworks including React, Angular, and Vue.
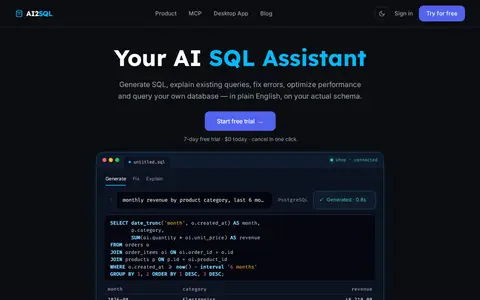
AI-powered SQL query builder enables you to quickly build SQL queries without any knowledge of SQL for beginners.
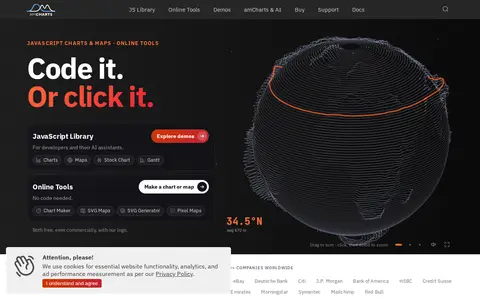
amCharts is a TypeScript library for JavaScript charts, offering 60+ chart types plus maps, stock charts, and Gantt charts. The site states the library is free to use and React-ready. Documentation lists React, Angular, Vue.js, Next.js, and other integrations.
AnyChart is a JavaScript charting library with an API and documentation. It offers a large number of chart types, and the site lists related products for stock charts, HTML5 maps and Gantt charts. Version 9.0.0 added chart types including arc diagram, dependency wheel, org chart, stream graph, waffle chart, lollipop and dumbbell. The library is described as working with any development stack.