
Directory

Search results

Published directory entries matching your search.

Search results

97 listings
count.co

Count is a collaborative platform for AI-powered analytics and research that requires explanations for AI-generated answers. Users work with data, files and tools to build canvases containing maps, charts and reports, with comments and tagging for teammates. A free tier includes one project, three canvases, up to five users and daily AI credit limits; the Pro plan costs $49 per editor per month with viewers free.


AI Data & Analytics 0
crimebrasil.com.br

Mapa do crime no Brasil com dados oficiais de polícia, DataSUS e CNJ. Busque sua cidade ou bairro e veja estatísticas por 100 mil habitantes.

AI Data & Analytics 0
data2-bourgesplus.opendata.arcgis.com

ArcGIS Hub site for Bourgesplus data allows users to discover, analyze, and download datasets in formats including CSV, KML, Zip, GeoJSON, GeoTIFF, and PNG. It provides API links for GeoServices, WMS, and WFS, and supports creation of StoryMaps and Web Maps for data visualization.

Dataset & Data Search 0
datamaps.github.io

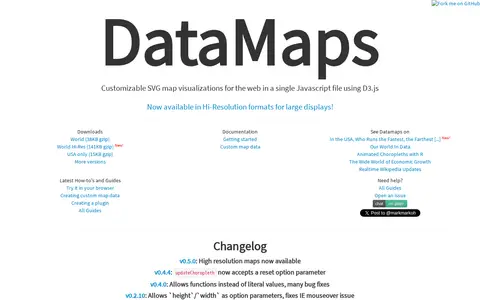
DataMaps is a jQuery plugin for geographical map data visualizations using d3.js and SVG. The page lists changelog entries, including high resolution maps in v0.5.0 and a reset option parameter for updateChoropleth in v0.4.4.

AI Data & Analytics 0
datastream.org

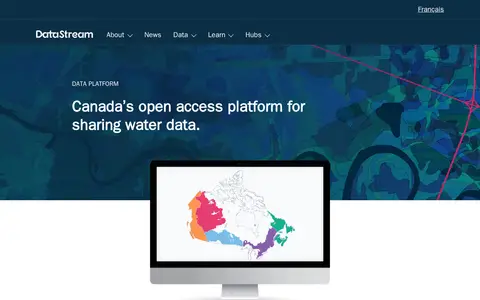
DataStream is an open access platform for sharing water and sediment quality data. It offers map-based search, interactive visualizations, standardized machine-readable datasets, dataset versioning, digital object identifiers, embargo periods and API access for integrating data with other websites and tools. A one-click charting tool allows comparison of results with national water quality guidelines.

Dataset & Data Search 0
Preview unavailable
deletedcity.net

An interactive web map that visualizes the 650 gigabyte Geocities backup made by the Archive Team on October 27, 2009. It arranges file-system neighborhoods and individual lots by file count, showing relative sizes when viewed in full and individual HTML pages when zoomed. Based on the 2012 installations The Deleted City 1.0 and 2.0.

Curated Directories 0
Preview unavailable
arcgis.com

ArcGIS dashboard visualizing recent earthquakes, locations, magnitudes, and related seismic data.

Maps & Navigation 0
epsteinsecrets.com

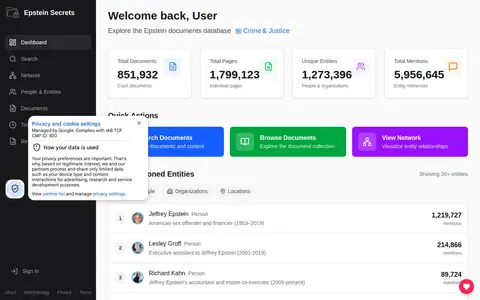
A searchable archive of public Epstein-related documents, including court filings, flight logs, depositions and the black book. It uses AI to extract people, organizations and locations mentioned in the documents and maps their connections in a network visualization.

Documents & Articles 0
simile-widgets.org

Exhibit is an open source publishing framework for creating data-rich interactive web pages. It provides advanced text search and filtering, along with interactive maps, timelines and other visualizations. The software is licensed under the BSD license and was originally sponsored partially by The Andrew W. Mellon Foundation as part of the SIMILE project.

AI Data & Analytics 0
Preview unavailable
finviz.com

A stock screener for investors and traders offering financial visualizations, with sections for stock and ETF screening, maps, charts, news, insider trading, futures, forex, crypto, watchlists and portfolios. An Elite tier is described as providing real-time data, technical charting, alerts and no ads.

Personal Finance 0
firealpaca.com

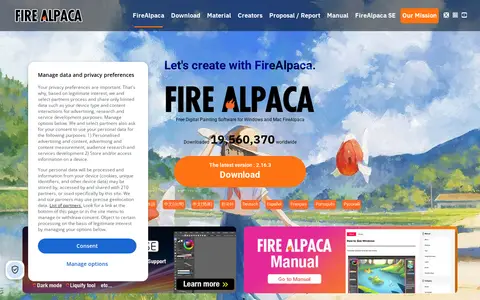
FireAlpaca is free digital painting software for Windows and Mac, available in 10 languages. It offers customizable brushes, weekly original brushes, five brush textures, and post-drawing line adjustment, along with tools such as frame work, animation, gradient map, and 3D perspective grid.

Image Editing & Design 0
freeclassicimages.com

Free Classic Images provides thousands of royalty-free, printable vintage picture images. The collection includes categories such as famous paintings, botanical illustrations, old maps, retro pin-ups and Victorian women, intended for papercraft, decoupage, scrapbooking, card making and wall art. The site states no subscription, no membership and no royalty.

Stock Images & Visual Assets 0
ggplot2.tidyverse.org

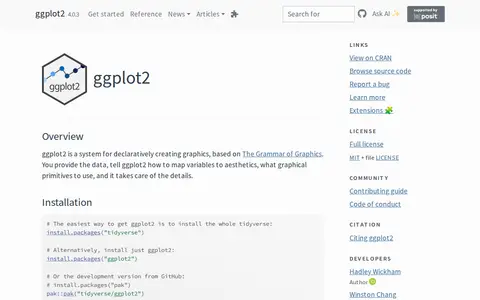
ggplot2 is a system for declaratively creating graphics, based on The Grammar of Graphics. Users provide the data and specify how variables map to aesthetics and which graphical primitives to use, and the system handles the details. It is described as over 10 years old, and installation is available through the tidyverse or as a standalone package.

AI Data & Analytics 0

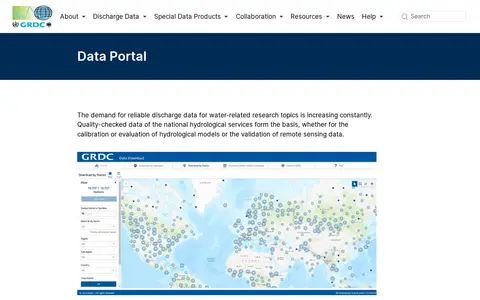
The GRDC Data Portal is a web-based tool for searching and visualising runoff stations and time series data in map and table view. Users select stations, regions, subregions or countries and download data in six formats, with optional subregion or watershed boundaries. Hydrological data are released only for research purposes; commercial use and redistribution are not allowed.

Dataset & Data Search 0
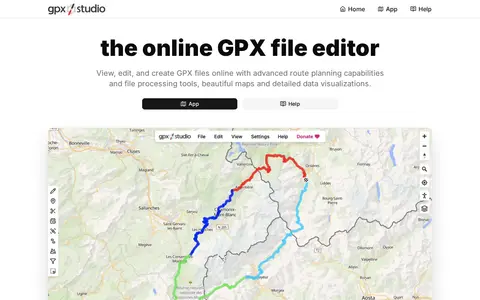
gpx.studio

GPX Studio edits, merges, cleans, and visualizes GPS tracks and route files in the browser.

Maps & Navigation 0
highcharts.com

High Charts is a JavaScript charting library designed for use in web applications, dashboards, grids and frameworks including React. It offers products for core charting, stock data, maps, Gantt charts, grids and dashboards, and is used by a large number of global enterprises. The library provides built-in adaptive functionality and extensive customization options for interactive data visualizations.

AI Data & Analytics 0
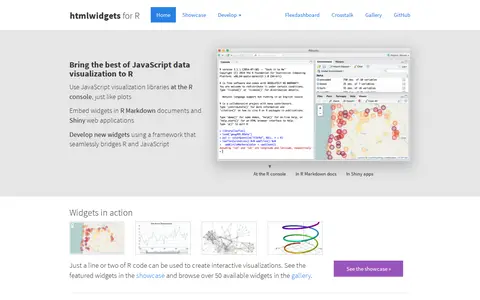
htmlwidgets.org

HTML widgets are R packages that produce interactive web visualizations, working like R plots. A line or two of R code produces a D3 graphic or Leaflet map. Widgets run at the R console and can be embedded in R Markdown reports and Shiny web applications. The page lists widget examples including Leaflet, dygraphs, Plotly and Highcharter, and describes composing dashboards with flexdashboard and linking widgets with crosstalk. New widgets can be developed by bridging R and JavaScript.

AI Data & Analytics 0
imageglass.org

ImageGlass is a free, open-source image viewer for more than 90 formats, including WEBP, GIF, SVG, HEIC and RAW. Version 10 is rebuilt on .NET and Avalonia as a single codebase for Windows, macOS and Linux. The viewer includes a color picker, EXIF metadata viewing, crop and resize tools, frame navigation and HDR tone mapping.

Image Utilities 0
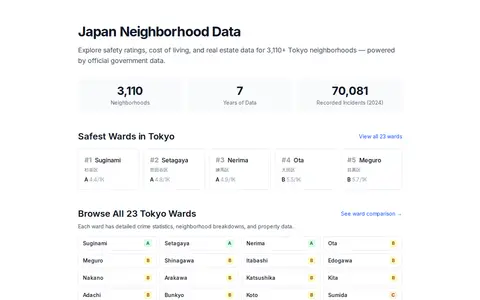
japanneighborhoods.com

Japan Neighborhoods provides data-driven neighborhood guides for Japan. It offers crime statistics, safety scores, demographic data, cost of living, and real estate information for over 5,000 Tokyo neighborhoods. The data is sourced from official government sources and presented through safety rankings, interactive maps, and property listings.

AI Data & Analytics 0

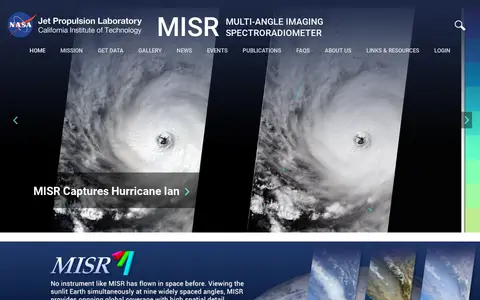
The Multi-angle Imaging SpectroRadiometer (MISR) is a NASA instrument onboard the Terra satellite, presented by the Jet Propulsion Laboratory. The site offers news, events, image quizzes and visualizations including 3D globe animations, world maps and stereo anaglyphs. It also references a tool for the MISR Plume Height Project.

Dataset & Data Search 0
kis3g.sk

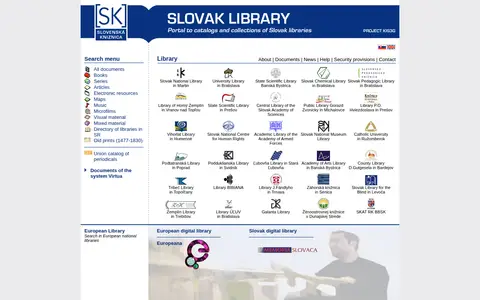
KIS3G is a portal providing access to the catalogs and collections of Slovak libraries as part of the European Library. It offers search functionality for books, series, articles, electronic resources, maps, music, microfilms, visual material, mixed material, old prints from 1477 to 1830, and a union catalog of periodicals, alongside a directory of libraries in the Slovak Republic.

Academic & Research Search 0
liveplasma.com

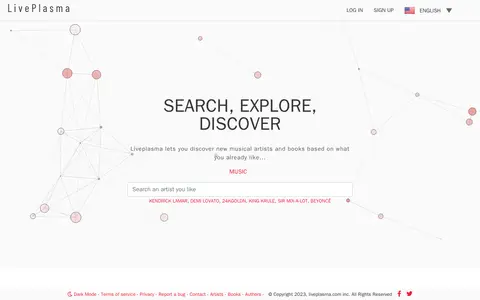
Liveplasma is a visual search and discovery engine that lets users discover new musical artists and books based on what they already like. It presents results as an explorable map of music and content.

Music Discovery & Databases 0
mapillary.com

Mapillary shows crowdsourced street-level imagery for roads, places, routes, and mapping projects.

Maps & Navigation 0
meereisportal.de

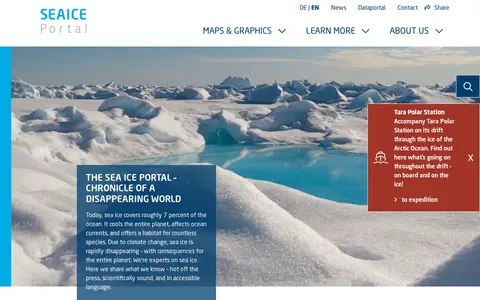
Meereis Portal is an online public portal focused on sea ice data and related resources. It provides daily updated sea ice concentration and extent data, annual cycle visualizations, interactive maps, animations, infographics, and educational content covering sea ice physics, desalination processes, and sea ice's role in the cryosphere and energy budgets.

Dataset & Data Search 0