Directory

Search results

Published directory entries matching your search.

Search results

105 listings
udeuschle.de

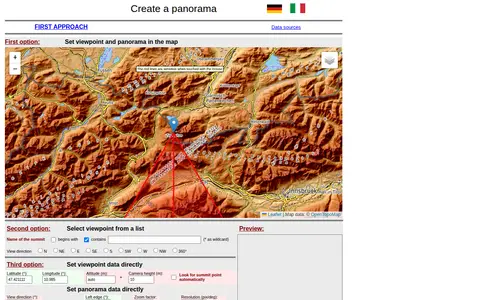
A web tool for creating mountain panoramas and identifying summits. A viewpoint can be set in a map, chosen from a summit list, or entered directly with latitude, longitude, altitude and camera height. View direction, zoom, resolution, tilt, sight range and elevation exaggeration can be set; JavaScript must be permitted.
Maps & Navigation 0
labs.tib.eu

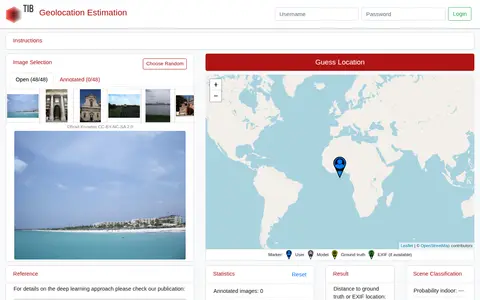
GeoEstimation is a tool for estimating the geolocation of photos. Users select an image from a predefined benchmark test set and click a world map to make a guess. Results are shown as a heat map of likely locations and a visualization of contributing photo parts, alongside scene classification probabilities for indoor, nature and urban settings.
Photography Tools 0
portal.o2a-data.de

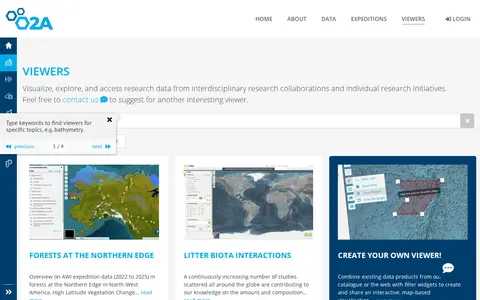
The GIS Maps Portal at AWI is part of the O2A Data Portal, which was developed by scientists for scientists to support FAIR research data management. It enables users to publish, visualize, browse, and access research data from both interdisciplinary research collaborations and individual research initiatives.

Dataset & Data Search 0
hyperiongray.com

Historical visualization and research record mapping a sample of linked Tor onion services.

Dark Web Archives & Historical Records 0
kartaview.org

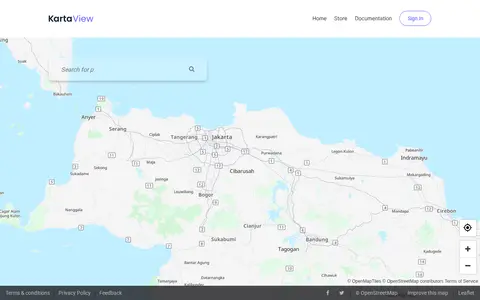
KartaView shows crowdsourced street-level imagery for roads, routes, and map improvement projects.

Maps & Navigation 0
maplight.org

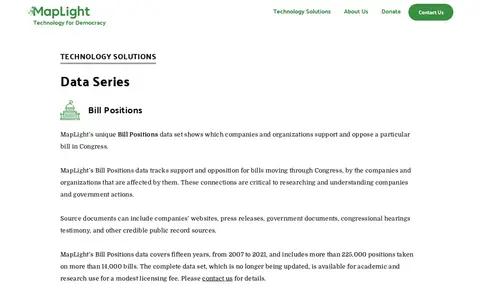
MapLight provides data series focused on United States federal campaign finance and congressional bills, intended for research and media organizations. Its Bill Positions dataset tracks which companies and organizations support or oppose specific bills moving through Congress, sourced from public records including company websites, press releases, and government documents. The dataset covers 2007 to 2021, includes more than 225,000 positions on over 14,000 bills, is no longer updated, and is available for academic and research use for a modest licensing fee.

AI Data & Analytics 0
redblobgames.com

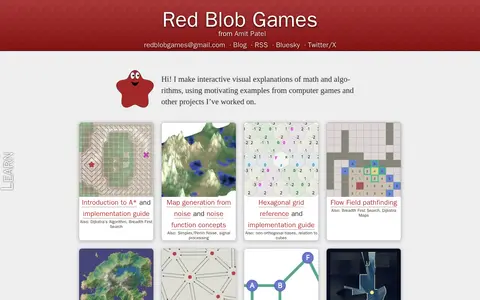
Red Blob Games publishes interactive visual explanations of math and algorithms, using examples from computer games and other projects. Topics include pathfinding, map generation from noise, hexagonal grids, Voronoi diagrams, graph theory and 2D visibility. Articles are free, with no signup and no ads, aimed mainly at independent, student and hobbyist software developers. The site also hosts demos such as map generators.

Science & Mathematics 0
github.com

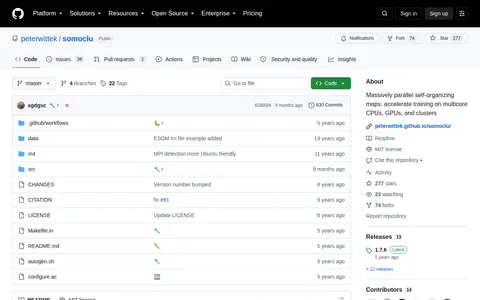
Somoclu is a massively parallel implementation of self-organizing maps, using multicore CPUs, MPI for cluster workload distribution, and CUDA acceleration. It supports OpenMP, MPI, and CUDA, runs on Linux, macOS, and Windows, and offers planar and toroid maps, rectangular and hexagonal grids, and Gaussian and bubble neighborhood functions. Both dense and sparse input data are supported, with interfaces for Python, R, Julia, and MATLAB.

AI Data & Analytics 0
github.com

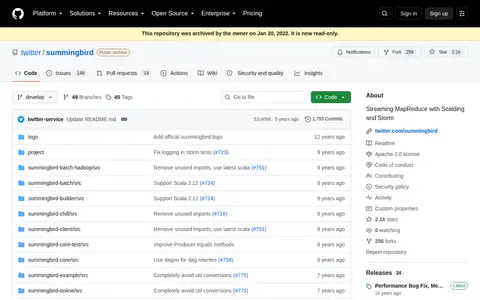
Summingbird is a library for writing MapReduce programs that resemble native Scala or Java collection transformations and running them on distributed MapReduce platforms including Storm and Scalding. Programs can execute in batch mode, realtime mode, or a hybrid mode combining Scalding and Storm. The repository was archived by its owner on Jan 20, 2022 and is read-only.

AI Data & Analytics 0
opendata.transport.nsw.gov.au

The Transport for NSW Open Data Hub provides a data catalogue for browsing, exploring and downloading datasets, connecting to APIs, and finding insights and interactive maps. It also offers geospatial files and interactive maps, interactive visualisations, and developer resources for accessing APIs and using real-time data. A further section covers innovation challenges and data partnerships.

Dataset & Data Search 0
Preview unavailable
omnisci.com

Interactive demo for exploring geotagged tweets and social activity on a map.

X / Twitter 0

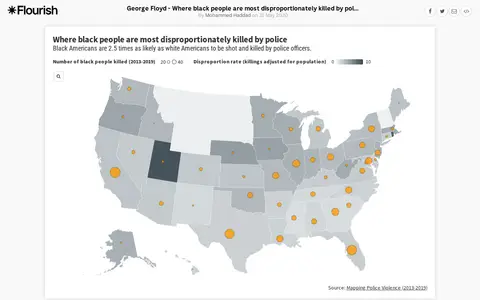
An interactive Flourish data visualisation by Mohammed Haddad, published 31 May 2020, showing where black people are most disproportionately killed by police. It uses a projection map template from the Flourish team and is hosted on the Flourish platform for interactive data visualisation and storytelling.

Legal, Police & Court Records 0
indiadataportal.com

India Data Portal is a search and discovery site for India's public datasets, presented under FAIR principles. It offers visualization tools such as bar, line, pie, table, scatter and map views, allows users to merge datasets using local directory codes, upload their own data for visualization, and download complete data. Public government datasets are accessible without a paywall.

Dataset & Data Search 0

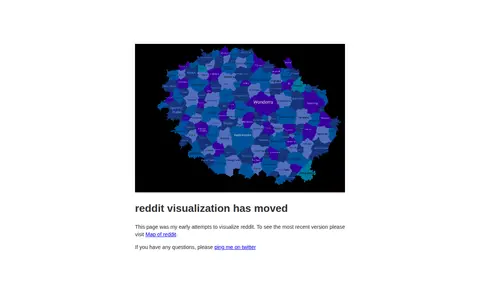
An early attempt to visualize how subreddits relate to each other. The page states that it has moved and directs visitors to a newer Map of reddit for the most recent version.

Reddit 0
amcharts.com

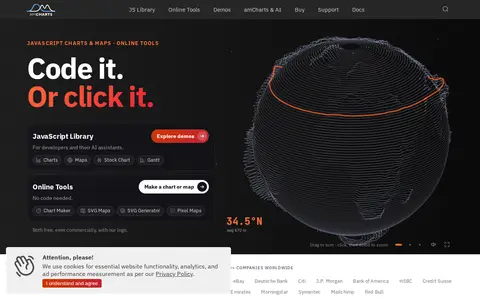
amCharts is a TypeScript library for JavaScript charts, offering 60+ chart types plus maps, stock charts, and Gantt charts. The site states the library is free to use and React-ready. Documentation lists React, Angular, Vue.js, Next.js, and other integrations.

AI Data & Analytics 0
dinosaurpictures.org

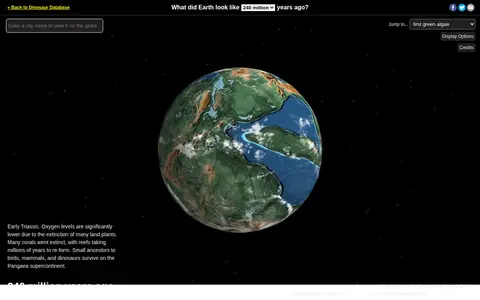
Ancient Earth is a visualization of the globe across 750 million years of Earth's history. Users can search for addresses and step through time periods, viewing paleogeographic maps by C.R. Scotese, with a globe that can be rotated and options to show clouds and the equator.

Maps & Navigation 0
anvil.works

Anvil is a Python-based drag-and-drop web app builder. It provides a visual designer, Python in the browser and on the server, and one-click deployment. Apps are automatically hosted, and deployment environments map a URL or Uplink key to a version of the app with its configuration. Apps can be exported from the cloud editor and hosted on a computer using the open-source Anvil App Server.

Web Development 0
anychart.com

AnyChart is a JavaScript charting library with an API and documentation. It offers a large number of chart types, and the site lists related products for stock charts, HTML5 maps and Gantt charts. Version 9.0.0 added chart types including arc diagram, dependency wheel, org chart, stream graph, waffle chart, lollipop and dumbbell. The library is described as working with any development stack.

AI Data & Analytics 0
bacmap.wishartlab.com

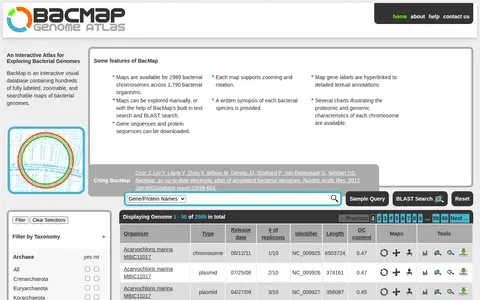
BacMap is an interactive visual database of annotated bacterial genomes, offering zoomable and searchable chromosome maps with hyperlinked gene labels. It provides searches by gene or protein name, genus, species, strain, biocard text and metabolic pathway, as well as BLAST search. Gene and protein sequences can be downloaded, and charts describe proteomic and genomic characteristics.

Dataset & Data Search 0
brenda-enzymes.org

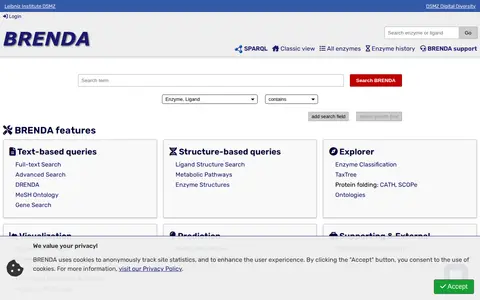
BRENDA is a comprehensive enzyme information system offering text-based and structure-based queries, an EC explorer, visualization, and prediction tools. It includes enzyme summary pages, ligand and tissue ontology searches, taxonomy and genome browsing, and pathway maps. The online version is free under the CC BY 4.0 license.

Dataset & Data Search 0
cardsmith.co

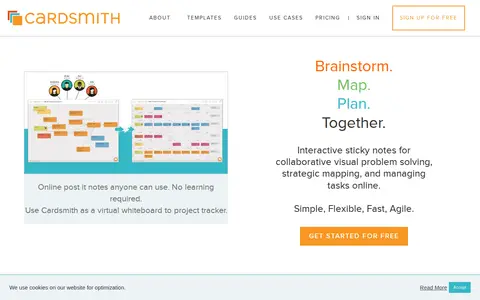
CardSmith is an online platform that provides interactive sticky notes on a virtual whiteboard for visual problem solving and project tracking. It supports real-time collaboration, allowing teams to brainstorm, map ideas, plan, and manage tasks together. The service is designed to be simple, flexible, fast, and agile, suitable for remote meetings, agile teams, coaching, and virtual workshops.

Text Editors & Formatting 0
cartodb.github.io

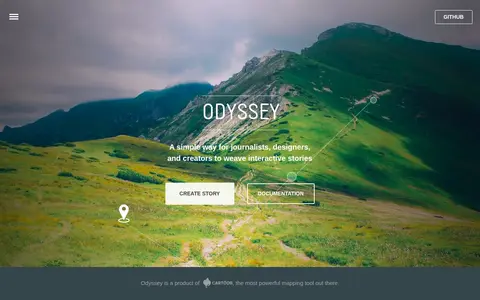
Odyssey.js is an open source tool that combines maps, narratives and other multimedia into stories. It offers templates including scrolling, slide based and temporal designs, and Actions for map movements and content display. The sandbox lets users test the library and edit story content with Markdown. It is an early-stage project developed by cartodb.com with Knight Foundation funding.

AI Data & Analytics 0
scitools.org.uk

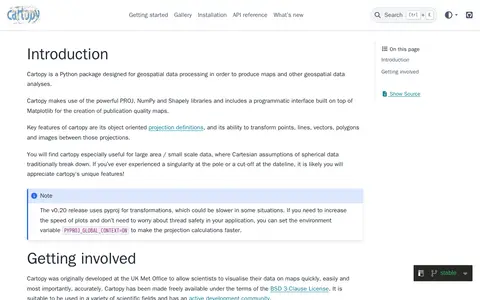
Cartopy is a Python package designed for geospatial data processing in order to produce maps and other geospatial data analyses.

AI Data & Analytics 0
library.ucsd.edu

The Cell Centered Database is an archived UC San Diego Library digital collection of high resolution 2D, 3D and 4D data from light and electron microscopy of tissues from the nervous system and other systems. It provides raw data, reconstructions and segmented data for download, plus 2D images, animations and image maps for online visualization.

Dataset & Data Search 0