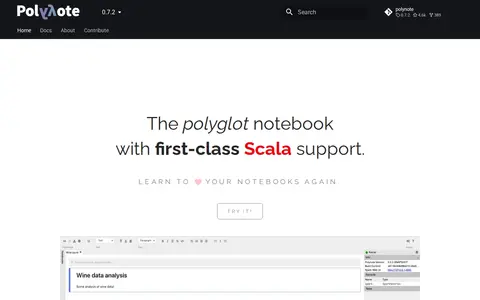

polynote.org
The polyglot notebook with first-class Scala support.
Directory
Published directory entries matching your search.
The polyglot notebook with first-class Scala support.

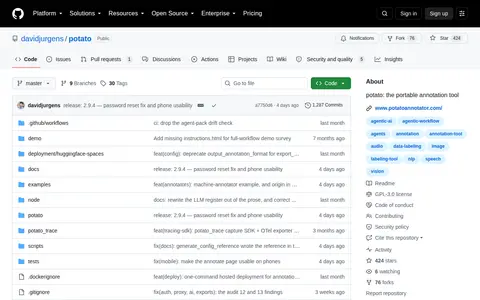
Potato is a portable annotation tool developed by davidjurgens and hosted on GitHub. It supports annotation work across a range of data types and annotation schemes, with documentation available for quick start guidance and use case details.

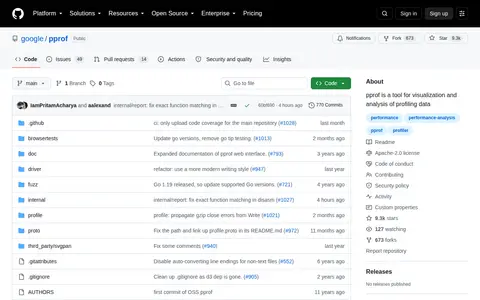
pprof is a tool for visualization and analysis of profiling data
Prash Chan is associated with the MDM – A GEEK'S POINT OF VIEW blog hosted at mdmgeek.com. The blog is run by data management expert Prash Chandramohan and covers topics including master data management, data quality, data governance, cloud, marketing, and leadership. It also offers free email subscriptions for new blog posts.

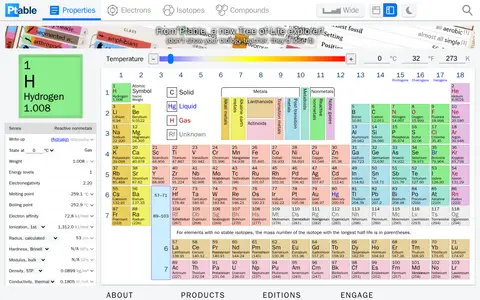
Ptable is an interactive periodic table of the elements showing names, electrons and oxidation states. It offers visualization of trends, 3D orbitals and isotopes, and allows users to mix compounds, with fully descriptive writeups.

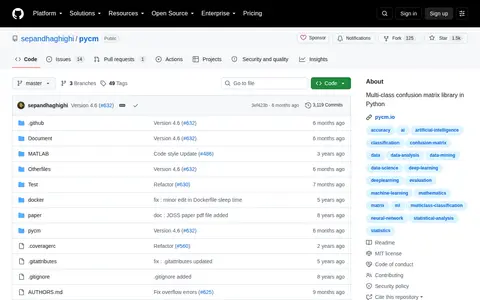
PyCM is a multi-class confusion matrix library written in Python. It supports input data vectors and direct matrices and offers post-classification model evaluation statistics. It is aimed at data scientists needing metrics for predictive models and classifiers. A MATLAB setup is also documented.
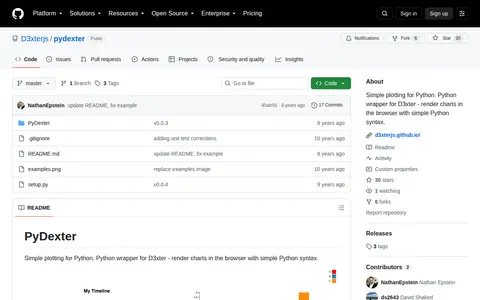
PyDexter is a Python wrapper for D3xter that renders charts in the browser using simple Python syntax. It supports histogram, scatter, plot, pie, timeline and bar chart examples. Installation is done with pip install PyDexter, and charts can be configured with settings such as height, width and title.
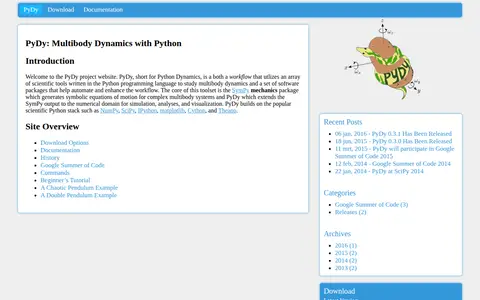
PyDy, short for Python Dynamics, is a workflow and set of software packages for studying multibody dynamics in Python. Its core is the SymPy mechanics package, which generates symbolic equations of motion for multibody systems, and PyDy extends that output to simulation, analyses, and visualization. It builds on NumPy, SciPy, IPython, matplotlib, Cython, and Theano.

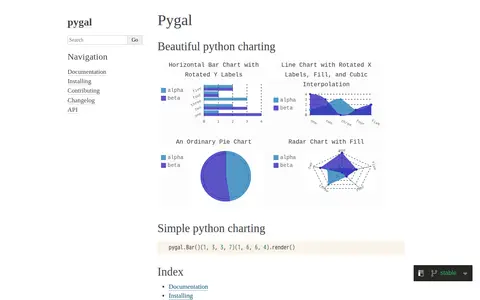
pygal is a Python charting library described as beautiful and simple python charting. Its documentation lists chart types including line, bar, histogram, XY, pie, radar, box, dot, funnel, gauge, pyramid and treemap, and output formats such as SVG, PNG and base 64 data URI.

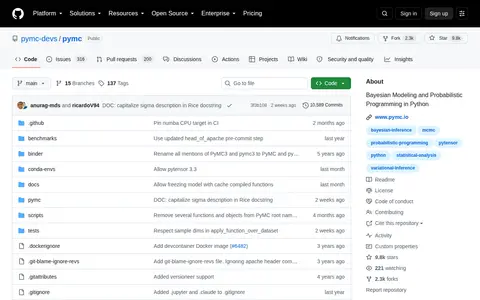
Markov Chain Monte Carlo sampling toolkit.
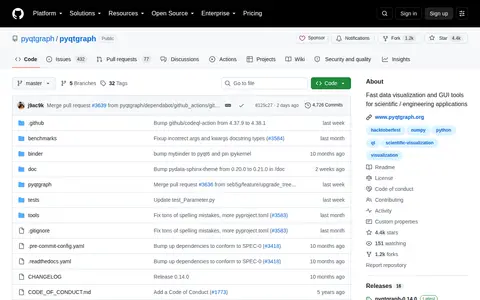
PyQtGraph is a pure-Python graphics library that uses the Qt framework. It is intended for mathematics, scientific and engineering applications, and relies on numpy for number crunching, Qt's GraphicsView for 2D display and OpenGL for 3D display. It supports Python 3.12+, Qt 5.15 or 6.8+, and numpy 2.2+.

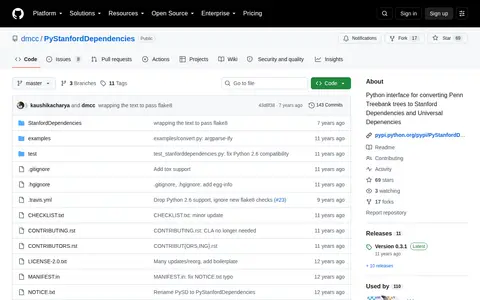
PyStanfordDependencies is a Python interface for converting Penn Treebank trees to Stanford Dependencies and Universal Dependencies. It offers a get_instance() function with subprocess or jpype backends, and convert_tree() or convert_trees() methods returning Token objects. Visualization options include asciitree, Graphviz dotgraphs, and interactive xdot windows. A Stanford CoreNLP or Parser jar file can be supplied, or downloaded automatically.

A hands-on, project-based introduction to programming with Python by Eric Matthes, published in its third edition in December 2022. The book covers basic concepts such as variables, lists, classes, and loops, and guides readers through projects including a Space Invaders-inspired arcade game, data visualizations, and a simple web application.
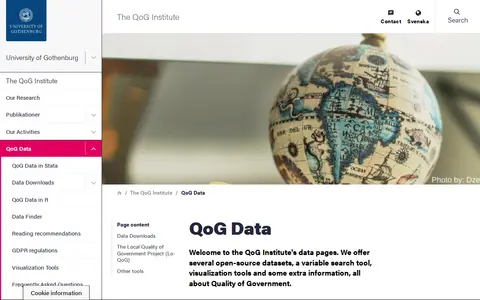
The Quality of Government Institute's data pages offer open-access datasets, including compilation datasets from other sources and original datasets created by QoG researchers. Original datasets cover quality of government, transparency and public administration, including an expert survey and the European Quality of Government Index. The pages also provide a variable search tool, visualization tools and related information.
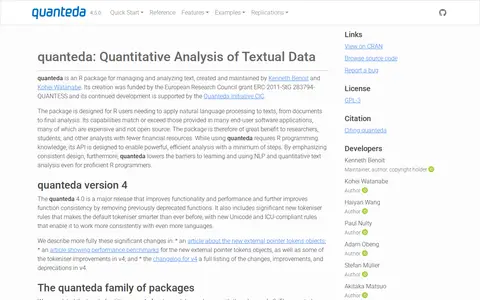
quanteda is an R package for managing and analyzing text, described as a fast, flexible, and comprehensive framework for quantitative text analysis in R. It provides functionality for corpus management, tokens and n-grams, keywords in context, sparse matrices, content dictionaries, and supervised and unsupervised machine learning.

A python framework to transform natural language questions to queries in a database query language.

Quilt is a scientific data management platform hosted on Amazon Web Services (AWS) that helps teams and AI systems locate, verify the trustworthiness of, and reuse data via deeply versioned, context-rich data packages.
Open source GPU accelerated data science libraries.

Rating Graph is an online visualization tool that generates graphs about TV shows and movies based on user ratings. It presents ratings and trends for tens of thousands of TV shows, movies, franchises, directors and writers, with new graphs, daily updates and histories. The site describes itself as a one-man hobby project.

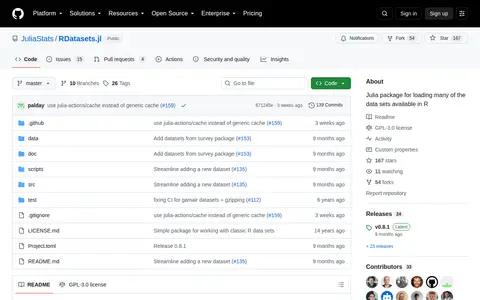
Julia package for loading many of the data sets available in R.

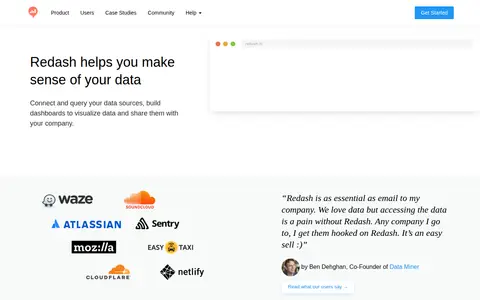
Redash is an open source tool for connecting to data sources, querying, visualizing and sharing data. It supports SQL, NoSQL, Big Data and API sources including PostgreSQL, MySQL, Redshift, BigQuery and MongoDB. Users build dashboards, set alerts and manage access.

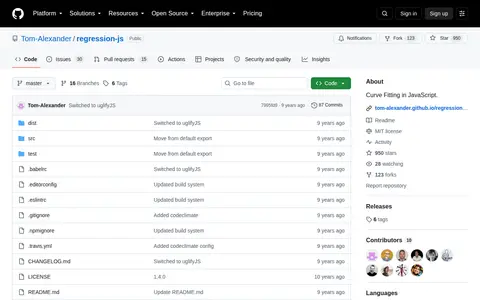
regression-js is a JavaScript library for curve fitting. It is hosted on GitHub and can be contributed to by the community. It is open source and available for installation via npm.

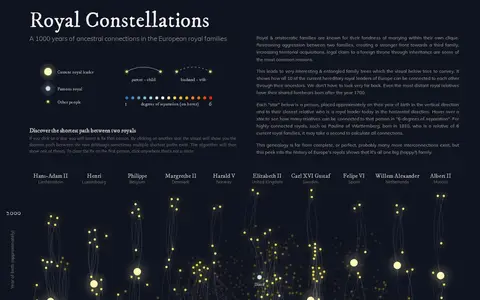
Royal Constellations is a visualization exploring a thousand years of ancestral connections in the European royal families. Clicking stars selects people and shows the shortest path between two royals. Each star is a person placed by year of birth and proximity to a royal leader today.

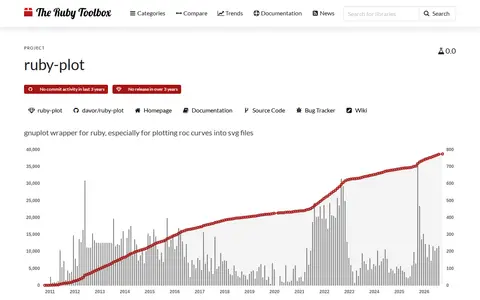
ruby-plot is a Ruby wrapper around gnuplot, especially for plotting ROC curves into SVG files. It requires gnuplot to be installed and has had no release in over three years.