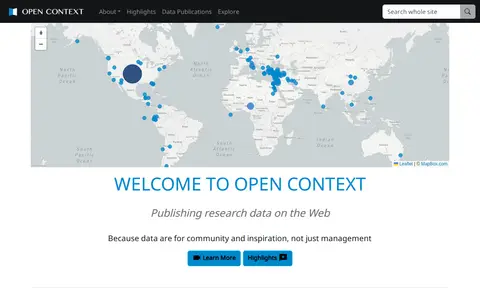
Open Context is a publishing service for archaeological and related research data, including images, maps, field notes and 3D models. It explains publishing of field documentation and data, faceted search and map-based visualization, and data download. It charges a one-time fee for publishing services, with project tiers such as a small project at $350.
Directory
Search results
Published directory entries matching your search.
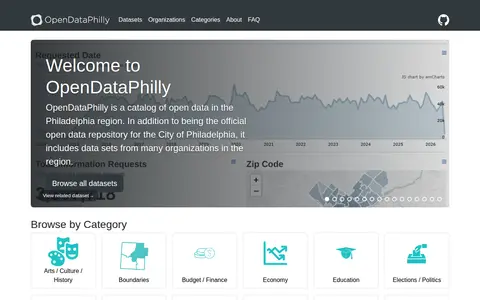
OpenDataPhilly is a catalog of open data in the Philadelphia region. It is the official open data repository for the City of Philadelphia and also includes data sets from many organizations in the region. The catalog covers categories such as arts, culture and history, boundaries, budget and finance, economy, education, elections and politics, environment, food, health and human services, parks and recreation, planning and zoning, public safety, real estate and land records, and transportation.
Open Data Platform: India Smart Cities is a portal under India's Smart Cities Mission, operated by the Ministry of Housing & Urban Affairs. It serves as a single-point access to open format resources published by Indian government ministries, departments and organizations, and hosts datasets, visualizations, blogs and infographics. The portal supports the DataSmart Cities Strategy to help urban areas address complex challenges with data.
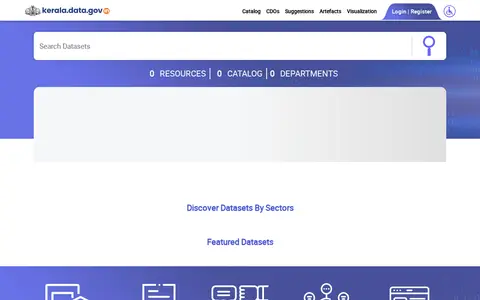
Open Government Data of Kerala is a portal associated with the Open Government Data (OGD) Platform India. The OGD Platform India serves as a single-point access to open format resources published by Indian government ministries, departments and organizations, and provides details of open data events, visualizations, blogs and infographics.
Open SDG Data Hub is an ArcGIS Hub platform focused on dataset discovery and access. It allows users to discover, analyze and download data in formats including CSV, KML, Zip, GeoJSON, GeoTIFF and PNG. The platform provides API links for GeoServices, WMS and WFS, and supports the creation of StoryMaps and Web Maps for data visualization.
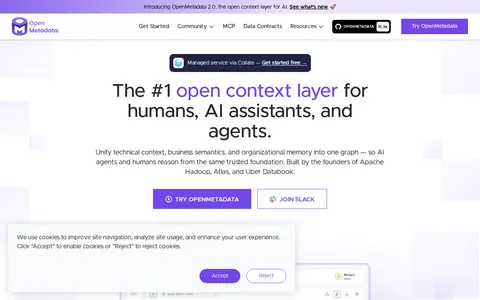
OpenMetadata is an open-source AI context layer powered by metadata, semantics, and memory that provides a shared, rich understanding of data for people and AI. It was built by the founders of Apache Hadoop, Apache Atlas, and Uber Databook. The unified platform supports data cataloging, discovery, quality, observability, governance, lineage, and collaboration.
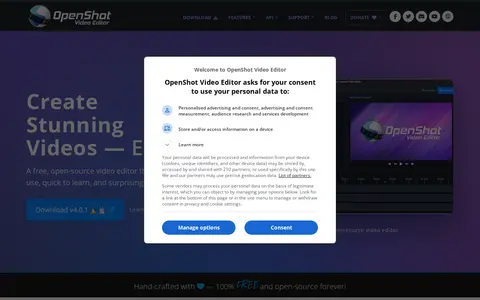
OpenShot is a free, open-source video editor for Linux, Mac, and Windows. It provides color grading and scopes, video effects, keyframe animation, timeline editing, transitions and wipes, interactive video masks, audio visualizations, and 2D and 3D titles. The project is written with Python and PyQt5, uses a C++ backend built on FFmpeg, and is distributed under the GNU General Public License.
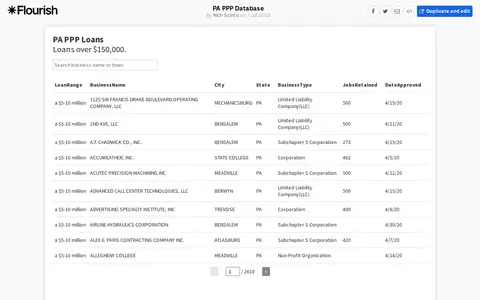
Pennsylvania PPP loan visualization for searching pandemic loan recipients and business records.
pandas is an open source, BSD-licensed library providing high-performance, easy-to-use data structures and data analysis tools for the Python programming language. It is described as a data analysis and manipulation tool built on top of Python. Documentation, a user guide and an API reference are available.
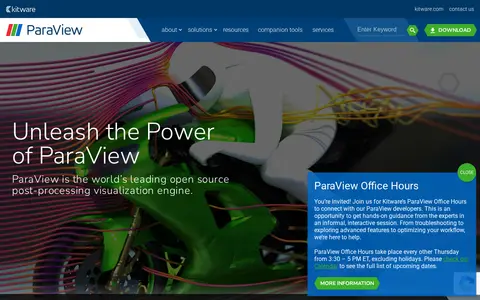
ParaView is an open-source, multi-platform data analysis and visualization application built to analyze extremely large datasets using distributed memory computing resources. It runs on Linux, macOS and Windows, from laptops to supercomputers, and includes readers for many file formats and more than 200 filters. It can also run in situ using ParaView Catalyst and in a web browser using trame.
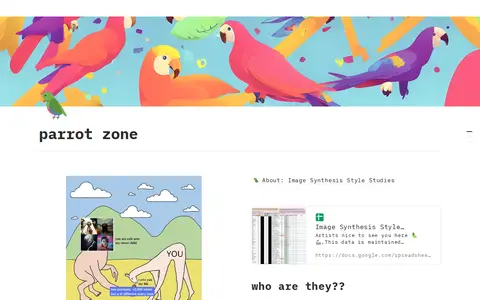
Parrot Zone is a Notion-hosted collaborative AI workspace designed to operate within an organization's existing context. It allows users to build and orchestrate AI agents alongside team projects, meetings, and connected third-party applications.
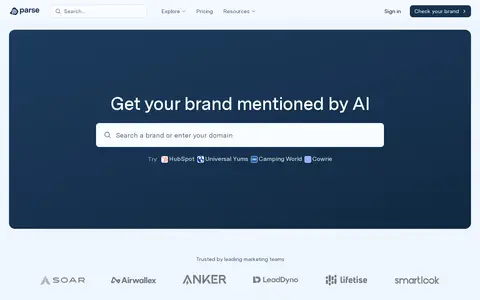
Parse indexes AI recommendations so brands know where they stand.
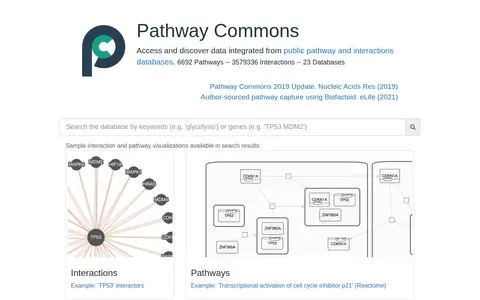
Pathway Commons collects and disseminates biological pathway and interaction data from partner databases, represented in the BioPAX standard. It provides search, visualization and web services, downloadable files in BioPAX, SIF and GMT formats, and tools such as PCViz, CyPath2, PaxToolsR and ChiBE. All data and software are free and open-source.
, a pluggable architecture for data and image processing, which can.
A globe visualization created by Nadieh Bremer and commissioned by Planet. It shows the locations of photos taken by Planet's satellites, and the page states that the desktop version shows 100% of the photos.
Planet Insights Browser is a component of the Planet Insights Platform that enables users to browse and compare full resolution satellite images from various data collections. Users can select an area of interest, define a time range and cloud coverage threshold, and inspect the results in the browser. The tool supports different visualizations, custom creation, high resolution image downloads, and timelapse generation. It provides visual, analytical, and download capabilities for satellite imagery.
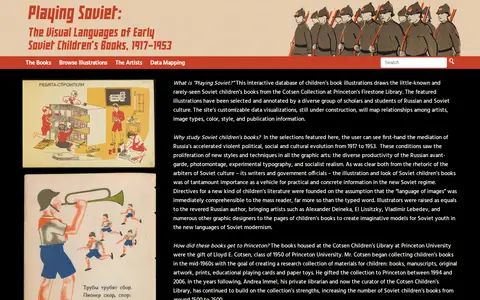
Playing Soviet is an interactive database of Soviet children's book illustrations drawn from the Cotsen Collection at Princeton's Firestone Library. The illustrations are selected and annotated by scholars and students of Russian and Soviet culture. The site says its data visualizations are still under construction and that its image database will grow by roughly 100 images a year.
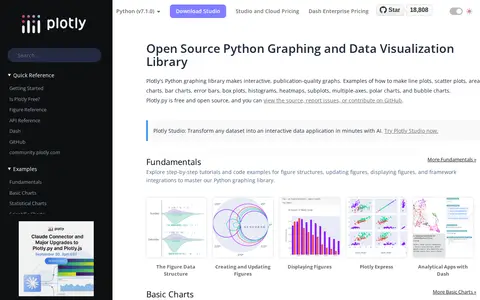
Plotly's Python graphing library is a free, open-source library for building interactive, publication-quality charts and graphs. It supports chart types including line plots, scatter plots, bar charts, error bars, box plots, histograms, heatmaps, subplots, multiple-axes, polar charts, and bubble charts. The source is available on GitHub.
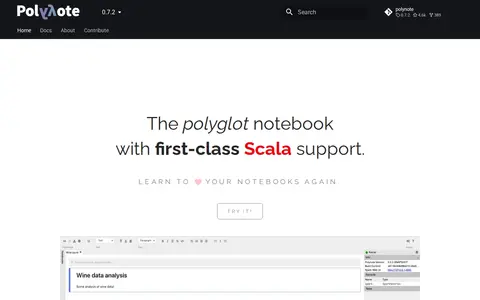
The polyglot notebook with first-class Scala support.
Prash Chan is associated with the MDM – A GEEK'S POINT OF VIEW blog hosted at mdmgeek.com. The blog is run by data management expert Prash Chandramohan and covers topics including master data management, data quality, data governance, cloud, marketing, and leadership. It also offers free email subscriptions for new blog posts.
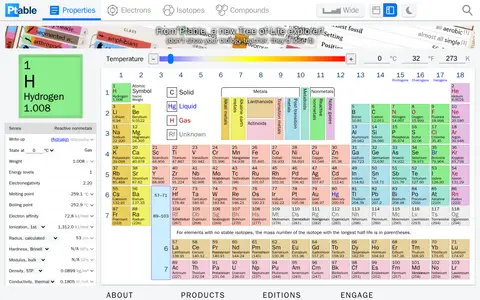
Ptable is an interactive periodic table of the elements showing names, electrons and oxidation states. It offers visualization of trends, 3D orbitals and isotopes, and allows users to mix compounds, with fully descriptive writeups.
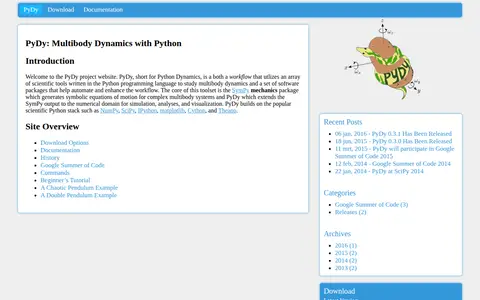
PyDy, short for Python Dynamics, is a workflow and set of software packages for studying multibody dynamics in Python. Its core is the SymPy mechanics package, which generates symbolic equations of motion for multibody systems, and PyDy extends that output to simulation, analyses, and visualization. It builds on NumPy, SciPy, IPython, matplotlib, Cython, and Theano.
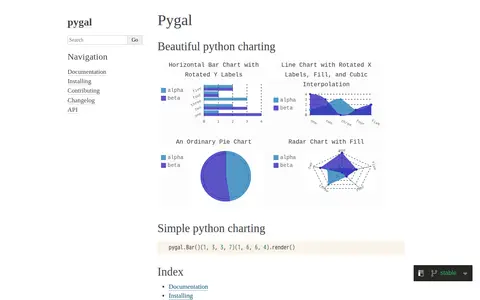
pygal is a Python charting library described as beautiful and simple python charting. Its documentation lists chart types including line, bar, histogram, XY, pie, radar, box, dot, funnel, gauge, pyramid and treemap, and output formats such as SVG, PNG and base 64 data URI.
A hands-on, project-based introduction to programming with Python by Eric Matthes, published in its third edition in December 2022. The book covers basic concepts such as variables, lists, classes, and loops, and guides readers through projects including a Space Invaders-inspired arcade game, data visualizations, and a simple web application.