Spotify Charts displays streaming charts with artist, genre, city and local pulse views, showing what music is moving listeners worldwide. Logging in with a Spotify account gives access to global charts and additional charts for genres and cities. The site states that charts are shaped by hundreds of millions of listeners daily.
Directory
Search results
Published directory entries matching your search.
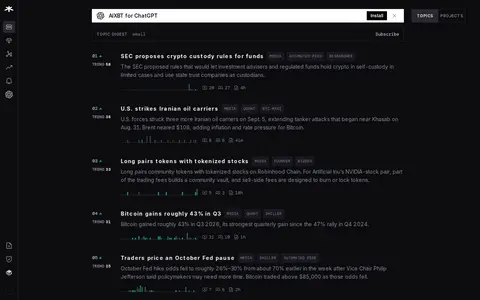
AIXBT provides crypto data, analytics, charts, and market intelligence for digital assets.
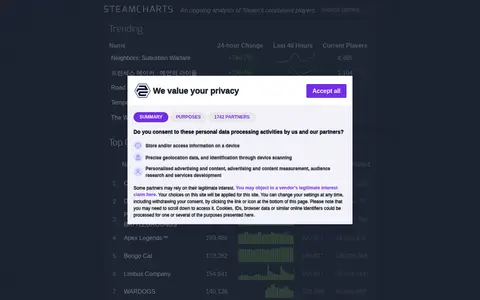
Steam Charts is a website that analyzes Steam player numbers and tracks which games have been played the most. It reports concurrent players, 24-hour changes, 30-day peaks, hours played and all-time peak player records. The site states that all data is powered by Steam and that it is not affiliated with Valve.
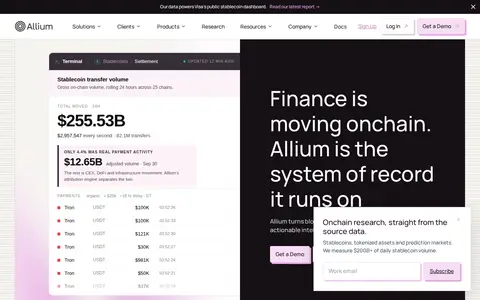
Allium provides on-chain analytics, dashboards, and crypto market intelligence for research.
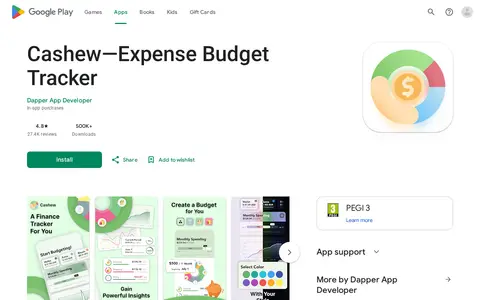
Android app for recording income and expenses, setting budgets, and reviewing spending charts. It also supports recurring-payment reminders and multiple currencies.
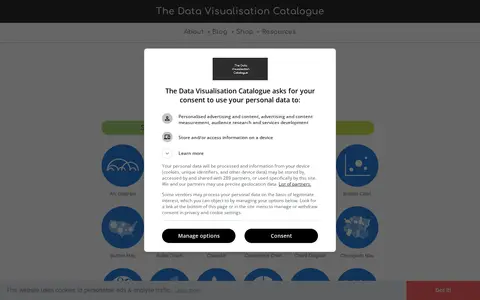
The Data Visualisation Catalogue is a project by Severino Ribecca that provides a non-code-based library of information visualization types. The site serves as a learning and inspiration resource, offering a searchable guide to chart methods such as bar charts, heatmaps and treemaps. Example images mostly use dummy data.
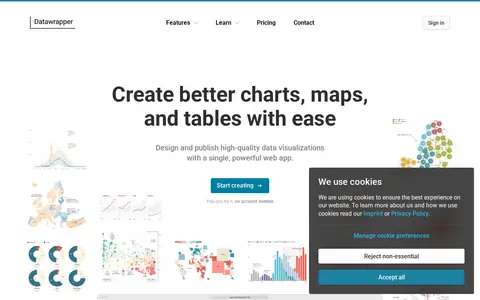
Datawrapper is an online tool for creating interactive charts, maps, and tables without code. It offers more than 20 chart types, over 4,000 basemaps for maps, and configurable tables. Visualizations are responsive and can be embedded on websites or exported to PowerPoint, PNG, PDF, and SVG. A step-based editor, custom themes, and real-time collaboration support design and publishing.