
kaushik.net
Occam's Razor applies AI to data analysis, extraction, visualization, or business intelligence.
Directory
Published directory entries matching your search.
Occam's Razor applies AI to data analysis, extraction, visualization, or business intelligence.

Open-source project that applies AI to data analysis, extraction, visualization, or business intelligence.

Open-source project that applies AI to data analysis, extraction, visualization, or business intelligence.

Open-source project that applies AI to data analysis, extraction, visualization, or business intelligence.

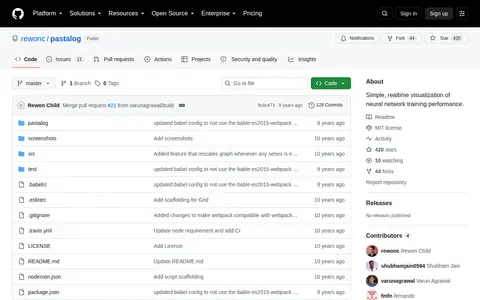
Pastalog is a realtime visualization server for neural network training performance. It works with Lasagne, Keras, Tensorflow, Torch, Theano and other frameworks. Data can be logged through a Python API, a Torch wrapper, or POST requests, and logged metrics update in real time at localhost.

Open-source project that applies AI to data analysis, extraction, visualization, or business intelligence.

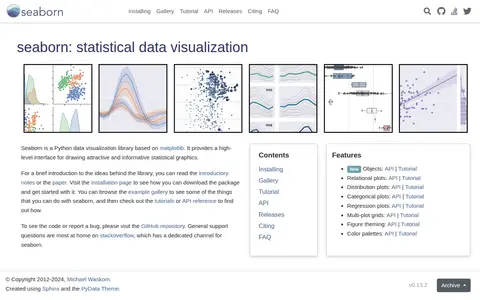
Seaborn is a Python data visualization library based on matplotlib. It provides a high-level interface for drawing statistical graphics, and covers relational, distribution, categorical, regression and multi-plot grids, along with figure theming and color palettes.

Tableau applies AI to data analysis, extraction, visualization, or business intelligence.

Workflow tool to automatically organize data visualization output.
Variance applies AI to data analysis, extraction, visualization, or business intelligence.

VisPy is a high-performance interactive 2D/3D data visualization library that uses GPUs through OpenGL to display large datasets. It offers a Pythonic, NumPy-aware interface for OpenGL ES 2.0 called gloo and an experimental OpenGL backend for matplotlib. The project is described as young and under heavy development, with high-level plotting interfaces still experimental.

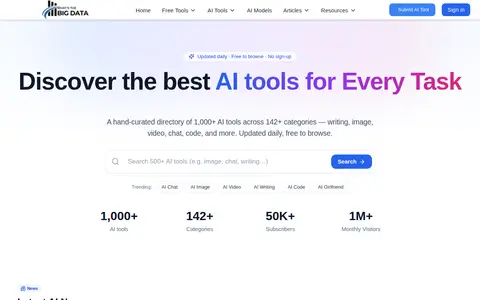
WhatSTheBigData applies AI to data analysis, extraction, visualization, or business intelligence.

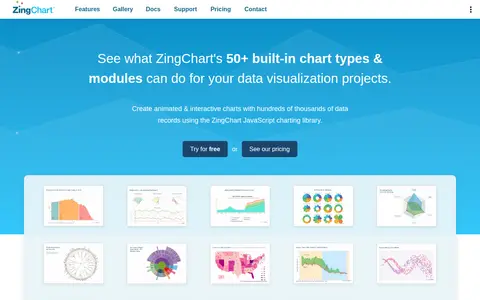
ZingChart is a dependency-free pure JavaScript charting library for data visualization. It includes over 50 built-in chart types and modules, uses simple JSON configuration, and offers integrations with popular JavaScript frameworks including React, Angular, and Vue.

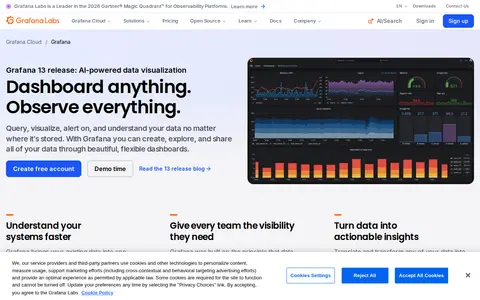
Multi-platform open source analytics and interactive visualization web application.

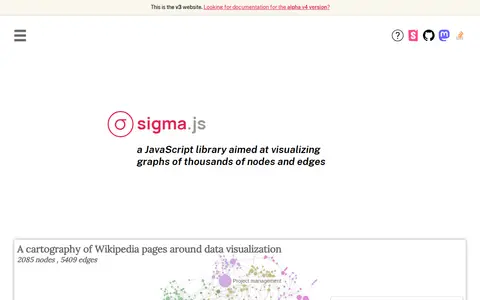
Sigma.js is a WebGL-powered JavaScript library for interactive graph visualization, built on graphology. It provides GPU-accelerated rendering, built-in pan, zoom, hover and multi-touch interactions, and works with React, Angular, Vue or vanilla JavaScript. Layouts, metrics and community detection come via graphology's standard library.

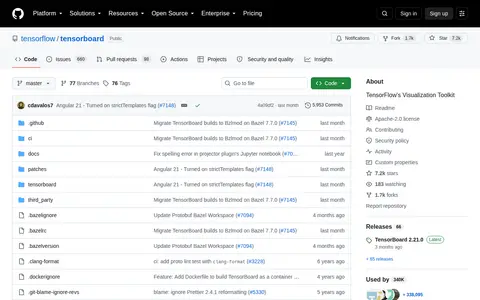
TensorFlow's Visualization Toolkit.

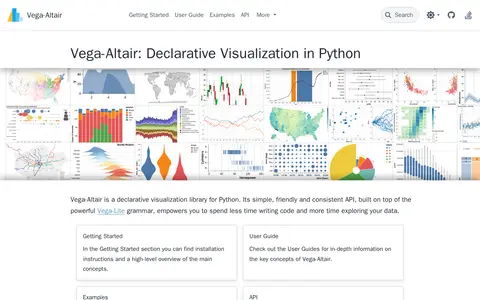
Vega-Altair is a declarative visualization library for Python with a simple, friendly and consistent API built on the Vega-Lite grammar. The project states it is not affiliated with Altair Engineering, Inc.

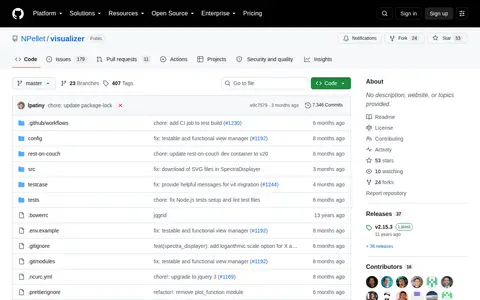
The visualizer is a tool developed by the cheminformatics department of the Swiss Federal Institute of Technology for rendering complex datasets. Its modules, placed on a browser page, display information as tables, charts, matrices or lists and interact through a central API of variables and actions. Visualization starts by passing three JSON file URLs in the browser address bar. It is released under the MIT license.

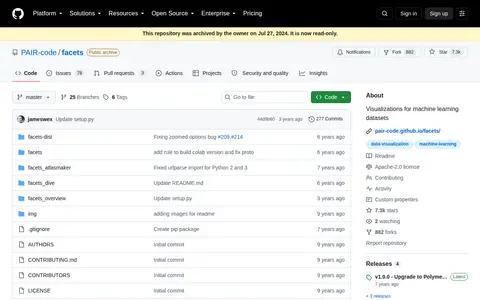
Facets is a project containing two visualizations, Facets Overview and Facets Dive, for understanding and analyzing machine learning datasets. The visualizations are Polymer web components backed by TypeScript that can be embedded in Jupyter notebooks or webpages. Overview produces feature-by-feature statistical analysis and compares statistics across datasets. The repository was archived on Jul 27, 2024 and is now read-only.

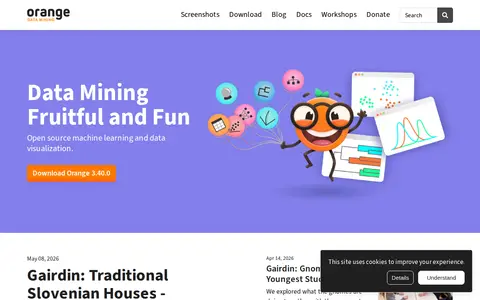
Orange is an open-source machine learning and data visualization toolbox. It offers visual programming in which widgets are placed on a canvas and connected to load datasets and analyze data. It supports interactive visualization methods including box plots, scatter plots, decision trees, hierarchical clustering, heatmaps, MDS, t-SNE and linear projections. Extensions add text mining, network analysis and other specialized capabilities.
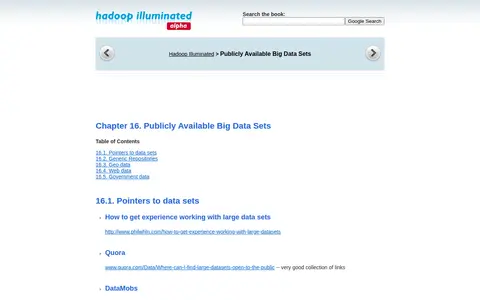
Hadoop Illuminated's Chapter 16 page lists pointers to publicly available big data sets, covering generic repositories, geo data, web data and government data. It links to sources such as Amazon AWS data sets, InfoChimps, the Comprehensive Knowledge Archive Network, OpenStreetMap, Wikipedia data, Google N-gram data, Freebase, data.gov and World Bank data.

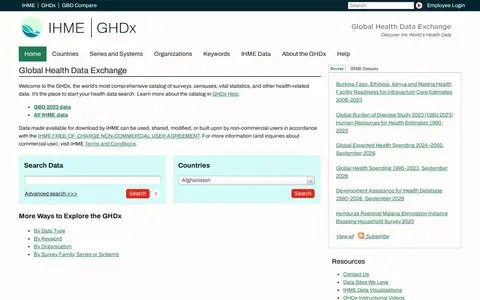
The Global Health Data Exchange (GHDx) is a catalog of global health and demographic data. It records information about data topics, links to data providers, and offers direct downloads where permission exists. The catalog covers surveys, censuses, vital statistics, registries, indicators, estimates, administrative health data, and health-related financial data. IHME-published data downloads may be used by non-commercial users under a free non-commercial user agreement.
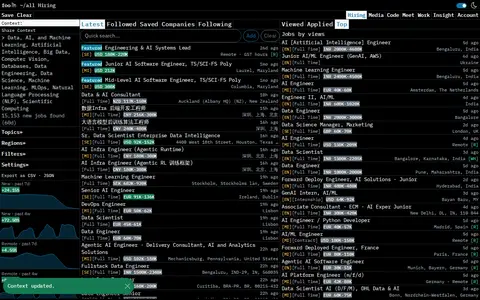
The go-to, no-nonsense, fast and lean job site in AI, ML, Data Science and Big Data.

The Master's programme in Management & Data Science is an English-language M.Sc. programme combining management education with data science techniques. It is aimed at students wanting to advance skills in data analysis of real-world phenomena, and covers intelligent data analysis, artificial intelligence, machine learning and data mining. It runs over four semesters and 120 CP according to ECTS.