



Clearbit is a B2B data provider that has joined HubSpot and describes itself as the first HubSpot Native Data Provider. It enriches records for leads, contacts and accounts, scores and routes leads in real time, and reveals buying intent from anonymous website traffic. Data comes from public web data, proprietary data and LLMs.
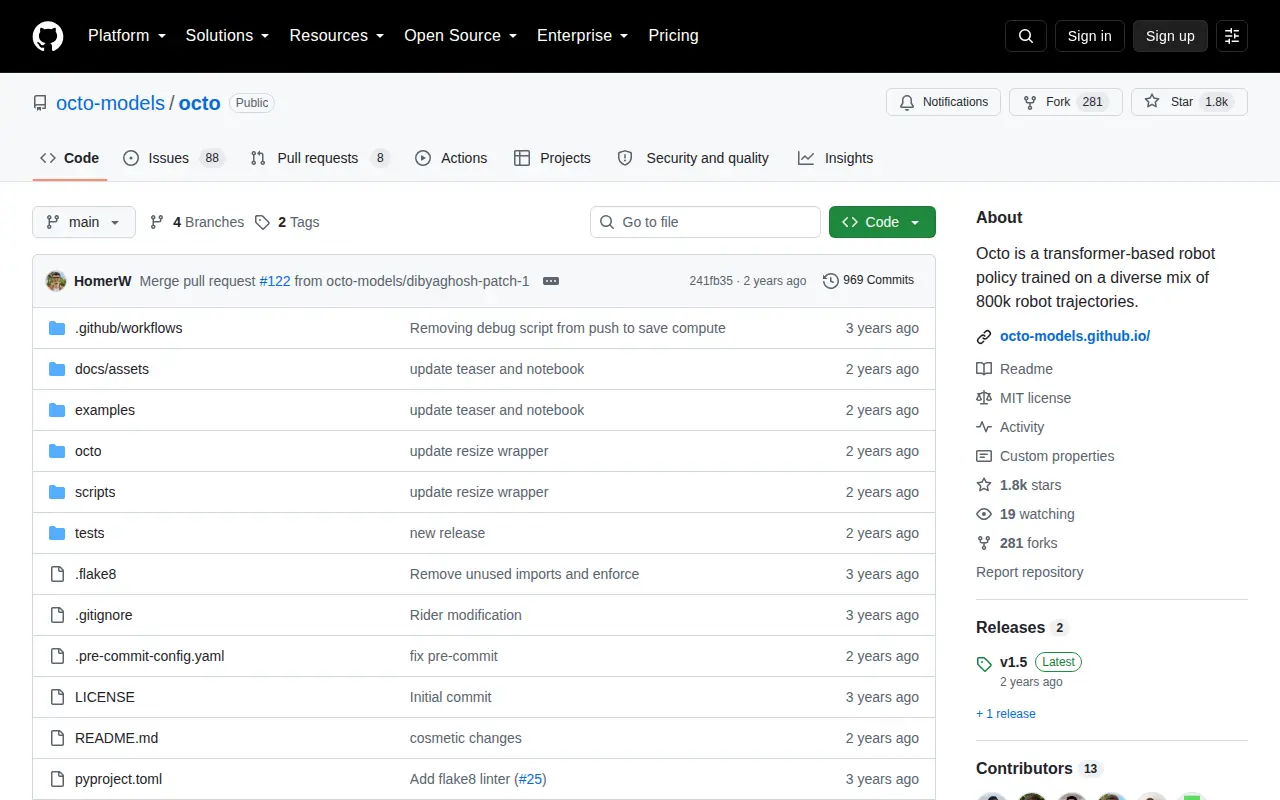
Octo
Open-source project that applies AI to data analysis, extraction, visualization, or business intelligence.
Links
Tags
-
0Clearbit is a B2B data provider that has joined HubSpot and describes itself as the first HubSpot Native Data Provider. It enriches records for leads, contacts and accounts, scores and routes leads in real time, and reveals buying intent from anonymous website traffic. Data comes from public web data, proprietary data and LLMs.
-
0Jupyter Notebook is a web-based interactive computing platform combining live code, equations, narrative text, visualizations, and dashboards. It supports over 40 programming languages, including Python, R, Julia, and Scala, and notebooks can be shared via email, Dropbox, GitHub, and the Jupyter Notebook Viewer.
-
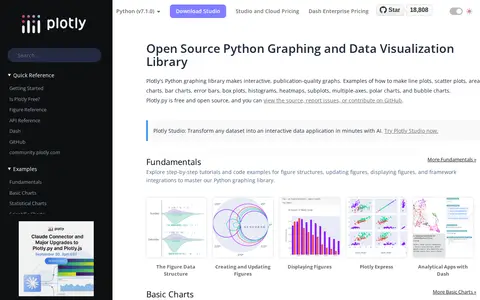
0Plotly's Python graphing library is a free, open-source library for building interactive, publication-quality charts and graphs. It supports chart types including line plots, scatter plots, bar charts, error bars, box plots, histograms, heatmaps, subplots, multiple-axes, polar charts, and bubble charts. The source is available on GitHub.
-
0Harvard Data Science applies AI to data analysis, extraction, visualization, or business intelligence.
-
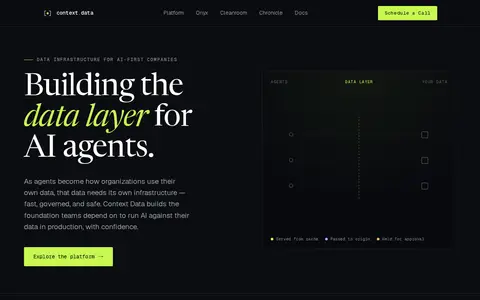
0InterLock is a proxy positioned between AI agents and databases, files and APIs. It authorizes each request by role and policy, redacts sensitive fields before the agent sees them, holds risky writes for approval and audits requests. It deploys as infrastructure inside the user's environment, and the agents and data stores do not change.
-
0
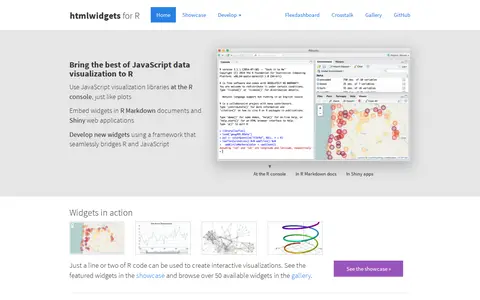
HTML widgets are R packages that produce interactive web visualizations, working like R plots. A line or two of R code produces a D3 graphic or Leaflet map. Widgets run at the R console and can be embedded in R Markdown reports and Shiny web applications. The page lists widget examples including Leaflet, dygraphs, Plotly and Highcharter, and describes composing dashboards with flexdashboard and linking widgets with crosstalk. New widgets can be developed by bridging R and JavaScript.
Community notes
Reviews and discussion
No reviews yet
Be the first to share how this project worked for you.
Join the discussion
Sign in with a verified account to leave a review or join the discussion.
Sign in to review