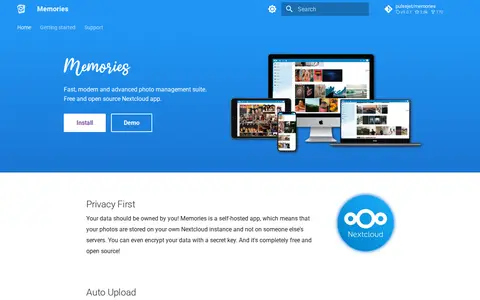

Memories is a free and open source photo management app for Nextcloud. It provides a photo timeline, albums, automatic tagging through the Recognize and Face Recognition apps, EXIF metadata editing, video transcoding, and a map of photos. Photos are stored on the user's own Nextcloud instance, and metadata is kept in EXIF headers to avoid lock-in.
Directory
Search results
Published directory entries matching your search.
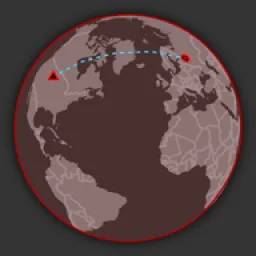
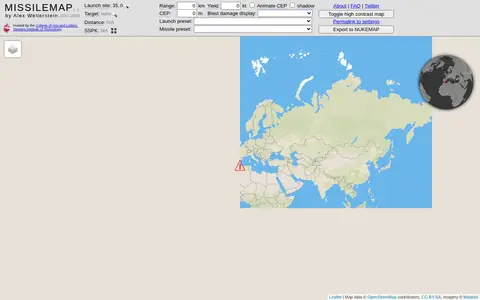
MISSILEMAP is a digital mapping visualization by Alex Wellerstein that graphically displays the range and accuracy of many types of missiles. It includes a location lookup and a Single Shot Probability of Kill calculator, and is intended to help show the relationship between missile range, accuracy and warhead size.
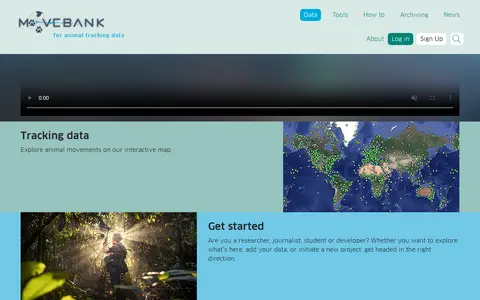
Movebank is a free online database of animal tracking data hosted by the Max Planck Institute of Animal Behavior. It helps animal tracking researchers manage, share, protect, analyze and archive their data, and offers an interactive map for exploring animal movements.
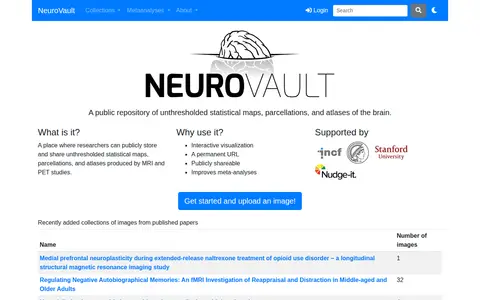
NeuroVault is a public repository where researchers can store and share unthresholded statistical maps, parcellations and atlases produced by MRI and PET studies. It offers interactive visualization, permanent URLs and publicly shareable images, and the site states it improves meta-analyses. An API provides access to atlases, collections and images.
New Westminster Open Data is the official open data portal for the city of New Westminster. It enables users to discover, analyze, and download municipal datasets in formats including CSV, KML, Zip, GeoJSON, GeoTIFF and PNG. The portal provides API links for GeoServices, WMS, and WFS, and supports the creation of StoryMaps and Web Maps for data visualization.
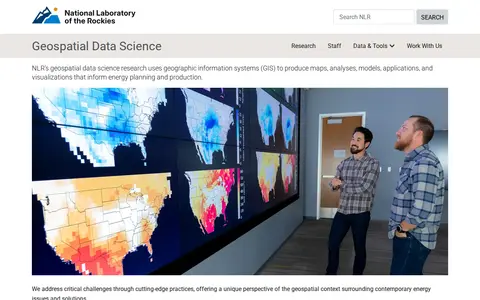
NLR's geospatial data science research uses geographic information systems (GIS) to produce maps, analyses, models, applications, and visualizations that inform energy planning and production. The work offers a geospatial perspective on contemporary energy issues and solutions.
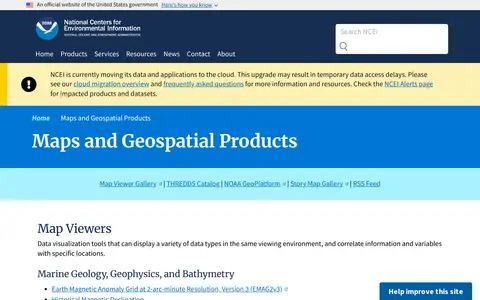
A National Centers for Environmental Information page presenting maps and geospatial products, including map viewers with data visualization tools and story maps combining maps, narrative text, images and multimedia. It also links to ArcGIS REST service directories for GIS servers with metadata and download formats for programmers and developers.
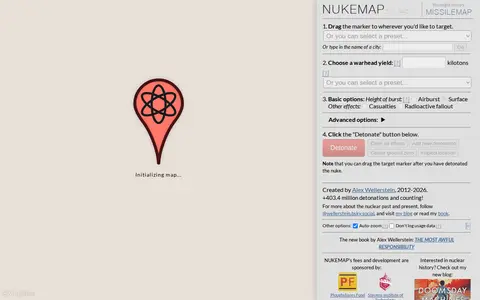
NUKEMAP is a website created by Alex Wellerstein for visualizing the effects of nuclear detonations. Users drag a marker to a target, choose a warhead yield or preset, and detonate; the map renders effects and supports export to Google Earth as KMZ.
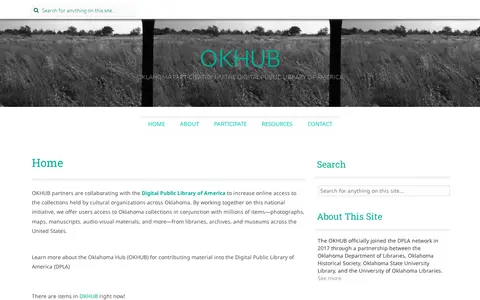
OKHUB is Oklahoma's participation in the Digital Public Library of America. Partners collaborate with DPLA to increase online access to collections held by cultural organizations across Oklahoma, offering users Oklahoma collections alongside millions of items such as photographs, maps, manuscripts, and audio-visual materials from libraries, archives, and museums across the United States.
Mermaid live editor for writing diagrams, flowcharts, sequence charts, and visual documentation.
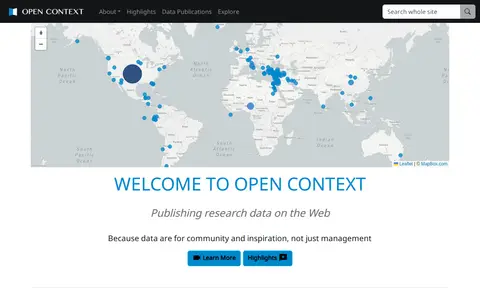
Open Context is a publishing service for archaeological and related research data, including images, maps, field notes and 3D models. It explains publishing of field documentation and data, faceted search and map-based visualization, and data download. It charges a one-time fee for publishing services, with project tiers such as a small project at $350.
Open SDG Data Hub is an ArcGIS Hub platform focused on dataset discovery and access. It allows users to discover, analyze and download data in formats including CSV, KML, Zip, GeoJSON, GeoTIFF and PNG. The platform provides API links for GeoServices, WMS and WFS, and supports the creation of StoryMaps and Web Maps for data visualization.
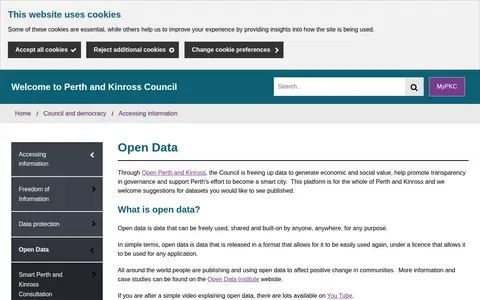
The Perth & Kinross Council Open Data portal, through Open Perth and Kinross, publishes council data as open data. The council states it is freeing up data to generate economic and social value, promote transparency in governance and support Perth's effort to become a smart city. The platform covers the whole of Perth and Kinross, offers maps and graph visualisation tools, and welcomes suggestions for datasets.
Pic2Map is an online EXIF data viewer with GPS support that allows users to locate and view photos on a map. It uses EXIF data found in photos from digital cameras, smartphones, and tablets. Without GPS data, it still serves as an online EXIF data viewer.
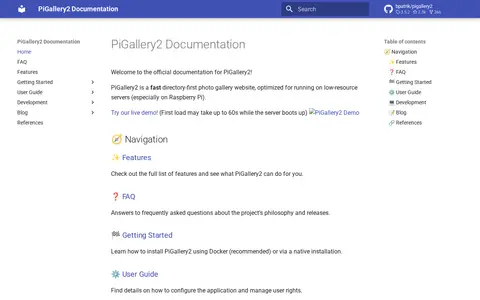
PiGallery2 is a self-hosted directory-first photo gallery website optimized for low-resource servers, especially Raspberry Pi. It offers a photo viewer with an information panel, maps using photo location data, and advanced searching with boolean logic, negation, exact and wildcard matching. Installation is possible via Docker or native setup.
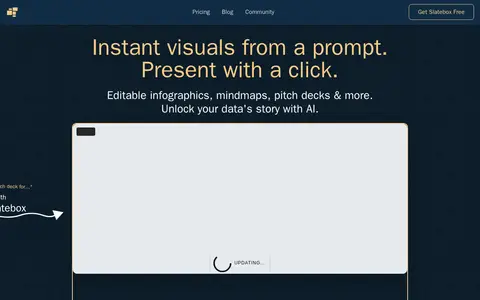
Slatebox creates visuals from a prompt, including infographics, mind maps, timelines, pitch decks and dynamic presentations. Slates are fully editable and can be presented with one click on an infinite canvas with multi-cursor collaboration. A PDF can be transformed into a presentation, and templates are available. Pricing during the beta includes a Forever Free plan and paid Solo-Pro and Team-Pro plans billed annually.
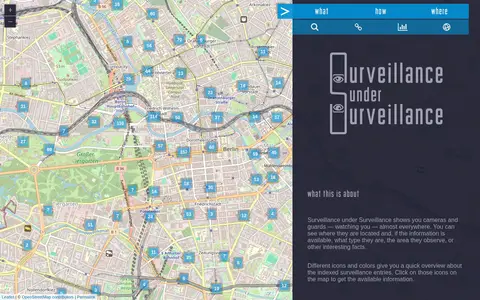
Surveillance under Surveillance is a map showing surveillance cameras and guards, with type, observed area and other information where available. It uses OpenStreetMap contributor data not visualized on the regular OpenStreetMap site, updated once an hour. New or revised entries can be added using an OSM account.
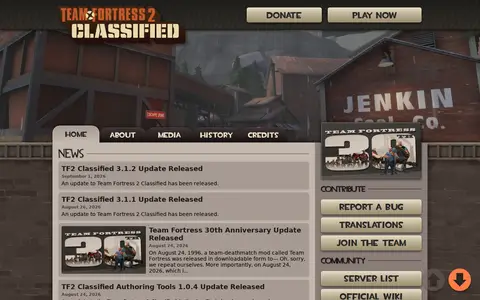
Team Fortress 2 Classified is a Team Fortress 2 experience built on its original inspirations and tone. It adds refreshed visuals, new gamemodes and maps, new weapons and new teams. The site lists version updates and separate Authoring Tools releases.
Humorous cyber threat map showing global attack-style visualizations for awareness and demos.
The Thunder Bay Open Data Portal is the City of Thunder Bay's public platform for accessing municipal datasets. It allows users to discover, analyze, and download data in formats including CSV, KML, Zip, GeoJSON, GeoTIFF and PNG. The portal provides API links for GeoServices, WMS and WFS, and supports the creation of StoryMaps and web maps for data visualization.
TimelineJS is an open-source tool for building visually rich, interactive timelines, described as a free, easy-to-use tool for telling stories in a timeline format. Beginners can create a timeline using a Google spreadsheet, while experts can use JSON skills for custom installations. The tool can pull in media from sources including Twitter, Flickr, YouTube, Vimeo, Google Maps, Wikipedia and SoundCloud.
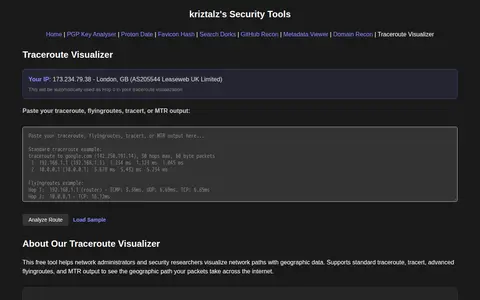
TracerouteVisualizer is a free browser tool that visualizes traceroute output with geographic maps. Users paste standard traceroute, tracert, flyingroutes, or MTR output, and the tool shows hop addresses, hostnames, locations, ISP and AS information, packet loss, response times and IXP detection. It is aimed at network administrators and security researchers for troubleshooting and security research.
Ukraine Live Cams is a 3D map visualization of live cameras in Ukraine, Drag and arrow keys move, mouse wheel or plus/minus keys zoom, and holding the right mouse button or Ctrl while dragging rotates and tilts the view.
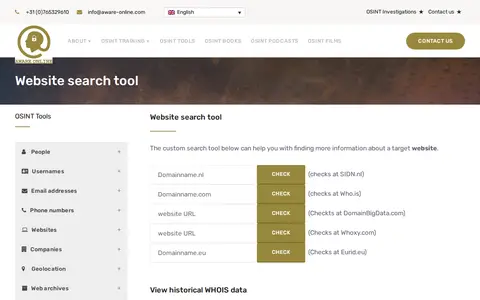
A custom OSINT tool from Aware Online Academy for investigating a target website. It provides scripts to view historical WHOIS data, check website text and source code on third-party sites, visualise links, map web pages, check Reddit presence, find open FTP ports and find other top level domains.