cs109.github.io
Analyzes structured data and helps produce queries, insights or visualizations.
Directory
Published directory entries matching your search.
Analyzes structured data and helps produce queries, insights or visualizations.

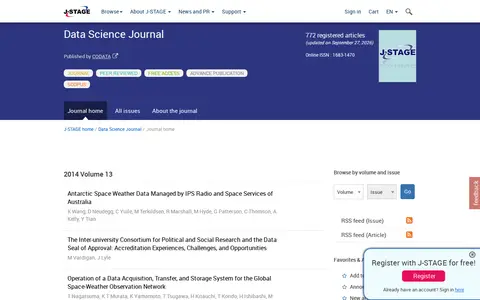
Data Science Journal is a peer-reviewed, free-access academic journal published by CODATA and hosted on the J-STAGE online platform for Japanese academic journals. It provides full-text articles, with 772 registered articles and advance publication listed on the journal home page.

Analyzes structured data and helps produce queries, insights or visualizations.

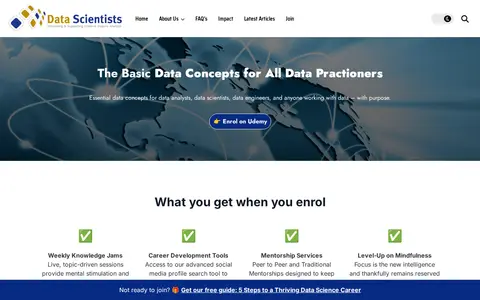
A membership program with a Udemy course on basic data concepts, weekly knowledge jams, career development tools and mentorship services. A limited-time membership is offered at $50 USD per year, cancellable anytime, and participants can join a LinkedIn community.

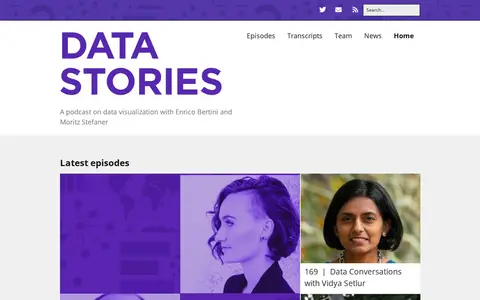
A podcast on data visualization hosted by Enrico Bertini and Moritz Stefaner. The site lists episode archives, news items and classics, and notes that transcriptions of 170 episodes were produced with Miska Knapek.
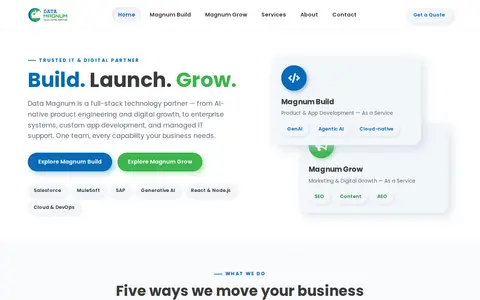
Data-Magnum is a full-stack technology services company. It offers AI-native product engineering and application development, digital marketing and growth services, enterprise systems implementation (Salesforce, MuleSoft, SAP), custom web and mobile app development, and managed IT support services.

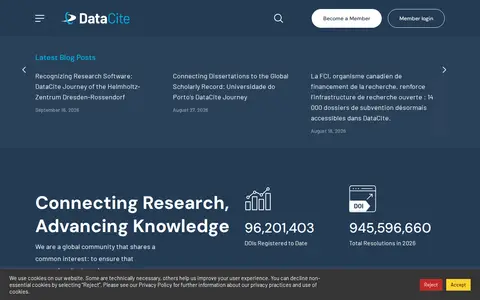
DataCite is an organization that supports research data management and discovery. It offers services including DOI creation for research outputs, metadata harvesting, research workflow integration, and resources to promote data reuse, with membership options for institutions and individuals.

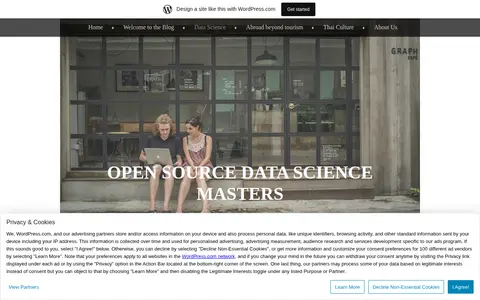
A blog documenting a self-designed open source data science master's program. Posts cover a six-month plan to become a data scientist, study examples after one month, MOOCs versus classroom learning, and a final project using the D3.js library to present what was learned.

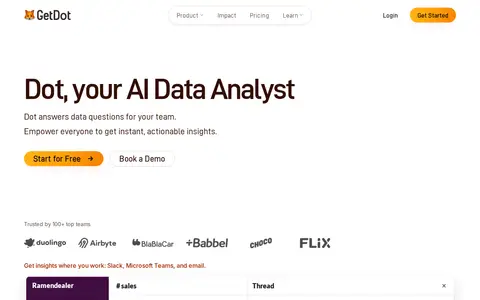
Dot is described as an AI data analyst that answers data questions, with chat, root cause analysis, automated reports and a context agent. Users can ask through Slack, Teams, email or the app, and answers show their queries and sources. A free tier offers 300 one-time credits.

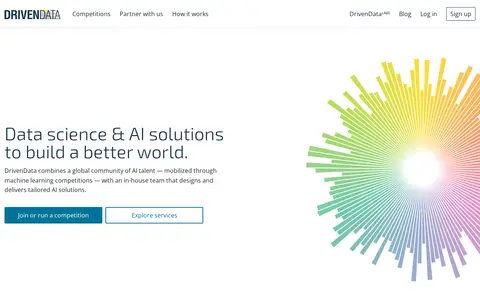
DrivenData hosts online machine learning competitions with social impact and works with mission-driven organizations on data science and engineering projects. It also maintains open-source projects for the data science community and shares prize-winning solutions from past competitions on GitHub. Areas of work include public health, conservation and international development.

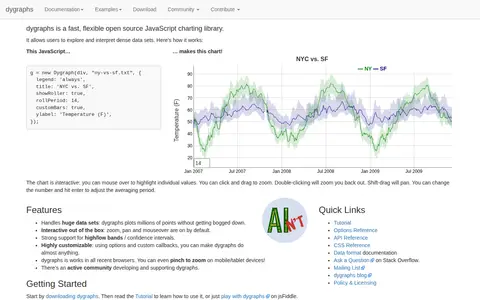
dygraphs is a fast, flexible open source JavaScript charting library that allows users to explore and interpret dense data sets. Charts are interactive, with zoom, pan and mouseover available by default, and the library handles very large data sets. It works in all recent browsers.
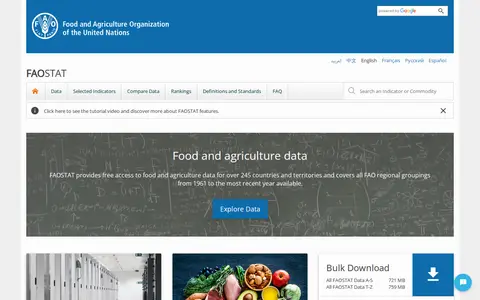
FAOSTAT is a database that provides free access to food and agriculture data for over 245 countries and territories. It covers all FAO regional groupings and includes data from 1961 up to the most recent year available. The service enables users to explore and analyze agricultural statistics globally.

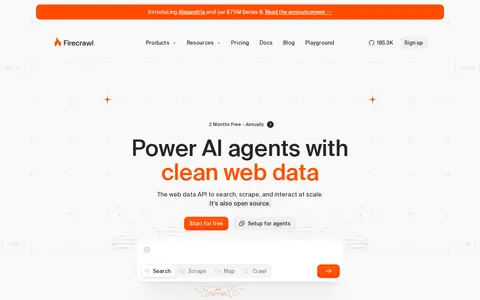
Firecrawl is a web data API designed for AI agents. It allows searching and scraping web content, returning data in formats such as JSON and Markdown. The service also provides access to Alexandria’s providers and specialized indexes. Firecrawl is open source, used by over 150,000 companies, and announced a $75 million Series B funding round.

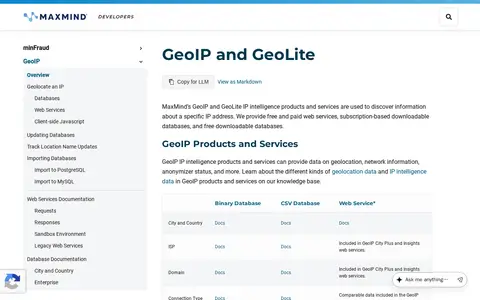
GeoLite databases and web services from MaxMind provide free geolocation and limited network data for IP addresses. The data is less accurate than MaxMind's paid GeoIP products. A free GeoLite account is required to download databases or query the web services, which use the same integration methods and documentation as GeoIP with minor modifications.

High Charts is a JavaScript charting library designed for use in web applications, dashboards, grids and frameworks including React. It offers products for core charting, stock data, maps, Gantt charts, grids and dashboards, and is used by a large number of global enterprises. The library provides built-in adaptive functionality and extensive customization options for interactive data visualizations.

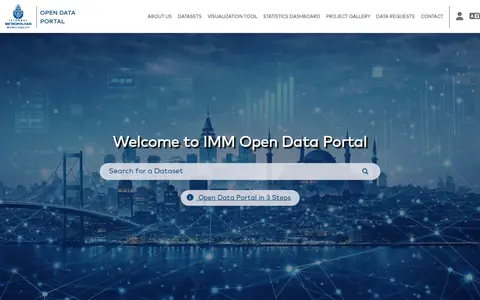
Istanbul Metropolitan Municipality's open data platform enables users to search for datasets by keyword or topic, review them, and download data or query it via API to create projects. Published datasets are labeled under categories such as energy, economy, environment, mobility and governance.

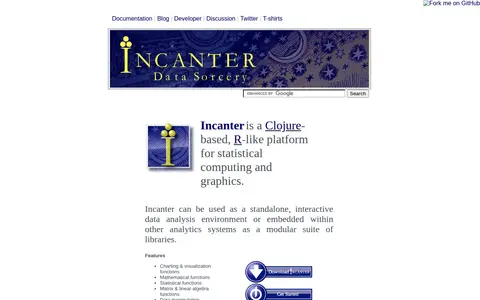
Incanter is a Clojure-based, R-like platform for statistical computing and graphics. It provides charting and visualization, mathematical, statistical, matrix and linear algebra, and data manipulation functions. It can be used as a standalone interactive data analysis environment or embedded within other analytics systems as a modular suite of libraries.
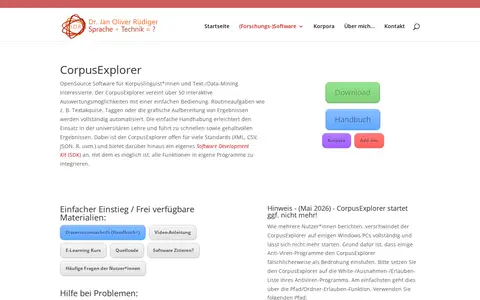
ML, DL and Data Science - with a focus on text-/data-mining.

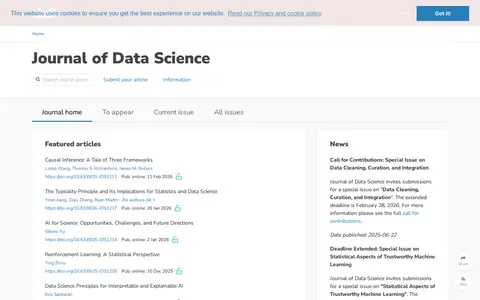
The Journal of Data Science is an academic journal listing featured articles, news, and calls for contributions. Featured articles include items on causal inference, reinforcement learning, and AI for science, each with a DOI and online publication date. The page also lists special issue calls for contributions and most-read articles.

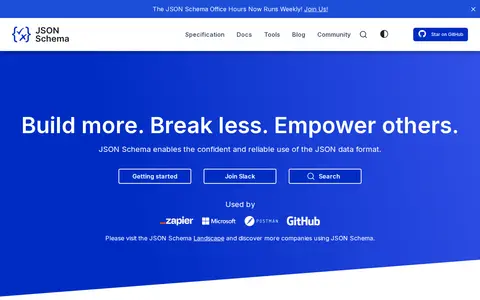
JSON Schema is a declarative language for annotating and validating JSON documents' structure, constraints, and data types. It enables JSON data consistency, validity, and interoperability, and has a tooling ecosystem of validators, generators, and linters. Documentation covers schema design, guides, and keyword reference.

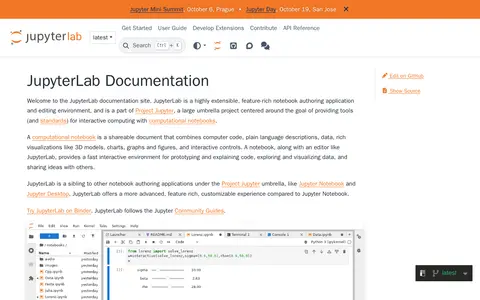
JupyterLab is an extensible notebook authoring application and editing environment within Project Jupyter. A notebook combines code, text descriptions, data and visualizations. JupyterLab provides an environment for prototyping and explaining code, exploring and visualizing data, and sharing ideas. It is a sibling to Jupyter Notebook and Jupyter Desktop and is described as offering a more advanced, customizable experience than Jupyter Notebook.
Analyzes structured data and helps produce queries, insights or visualizations.
Analyzes structured data and helps produce queries, insights or visualizations.

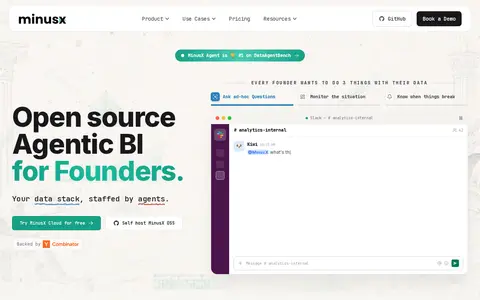
MinusX is an open source agentic business intelligence platform that combines a data agent with a BI tool. It answers questions, builds dashboards and sets alerts, with slides and data stories, visualizations and a SQL GUI. It can be self-hosted or used via MinusX Cloud, and the source is available and inspectable.