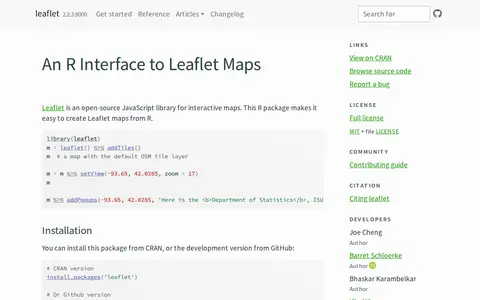
An R package that creates interactive Leaflet maps using the Leaflet JavaScript library and htmlwidgets. Maps can be used from the R console, RStudio, Shiny applications and R Markdown documents. It is linked to the open-source Leaflet JavaScript library for interactive maps.
DataScientistJourney
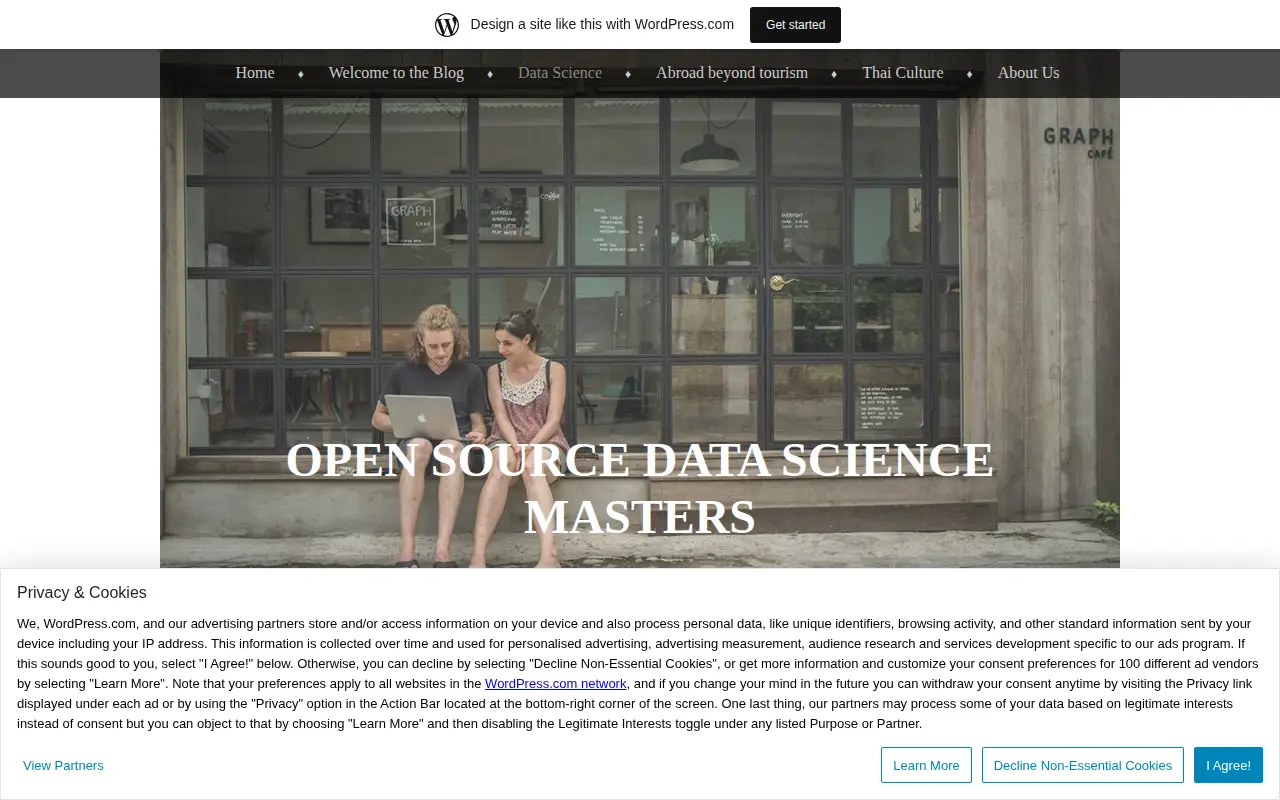
A blog documenting a self-designed open source data science master's program. Posts cover a six-month plan to become a data scientist, study examples after one month, MOOCs versus classroom learning, and a final project using the D3.js library to present what was learned.
Features
- built a dynamic website using the Javascript Library D3.js Source: datascientistjourney.wordpress.com
Links
Tags
-
0
An R package that creates interactive Leaflet maps using the Leaflet JavaScript library and htmlwidgets. Maps can be used from the R console, RStudio, Shiny applications and R Markdown documents. It is linked to the open-source Leaflet JavaScript library for interactive maps.
-
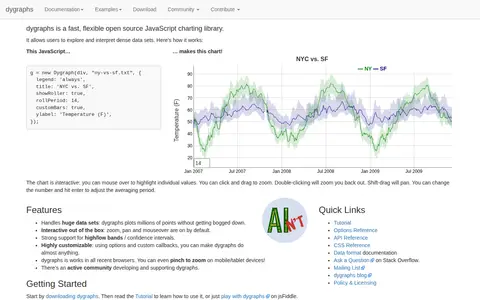
0dygraphs is a fast, flexible open source JavaScript charting library that allows users to explore and interpret dense data sets. Charts are interactive, with zoom, pan and mouseover available by default, and the library handles very large data sets. It works in all recent browsers.
-
0
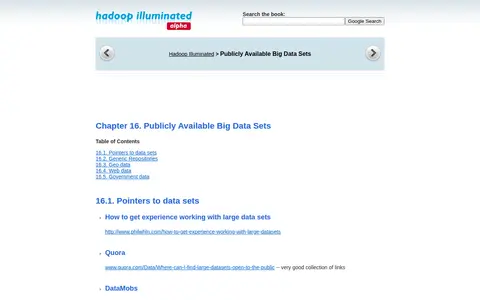
Hadoop Illuminated's Chapter 16 page lists pointers to publicly available big data sets, covering generic repositories, geo data, web data and government data. It links to sources such as Amazon AWS data sets, InfoChimps, the Comprehensive Knowledge Archive Network, OpenStreetMap, Wikipedia data, Google N-gram data, Freebase, data.gov and World Bank data.
-
0Master's Degree in Data Science and Computer Engineering @ University of Granada applies AI to data analysis, extraction, visualization, or business…
-
0
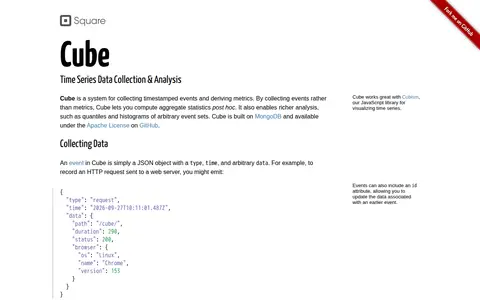
Cube is a system for collecting timestamped events and deriving metrics, built on MongoDB and released under the Apache License on GitHub. It accepts events via UDP, HTTP POST, and WebSockets, defines a query language for retrieving events, and groups events by time to compute aggregate metrics.
-
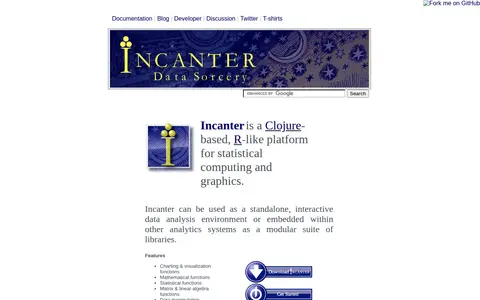
0Incanter is a Clojure-based, R-like platform for statistical computing and graphics. It provides charting and visualization, mathematical, statistical, matrix and linear algebra, and data manipulation functions. It can be used as a standalone interactive data analysis environment or embedded within other analytics systems as a modular suite of libraries.
Community notes
Reviews and discussion
No reviews yet
Be the first to share how this project worked for you.
Join the discussion
Sign in with a verified account to leave a review or join the discussion.
Sign in to review