
Data Visualization Ai Excel Togetherai E2b is a Hugging Face Space created by user Akshayram1. It allows users to upload CSV datasets, ask questions about the data, and receive AI-generated analysis and corresponding visualizations in response.
Directory
Search results
Published directory entries matching your search.
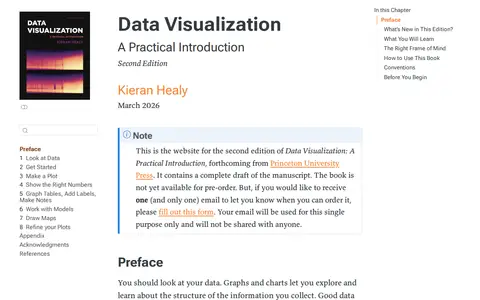
This is the website for the second edition of Data Visualization: A Practical Introduction by Kieran Healy, forthcoming from Princeton University Press. It contains a complete draft of the manuscript, and the book is not yet available for pre-order. According to the preface, the book teaches the ideas and methods of data visualization in a reproducible way.
Datacast is the personal blog and podcast series of James Le. It features written posts and podcast episodes covering topics such as data infrastructure, data observability, responsible AI, product management, and data engineering.
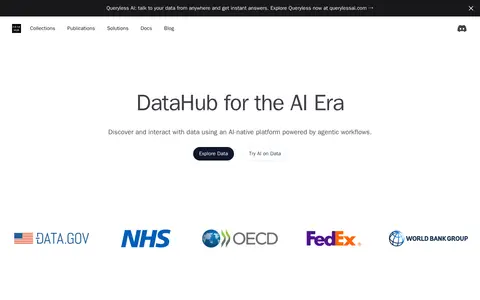
DataHub Cloud is a platform for discovering, accessing, and working with high-quality data. It offers curated datasets, including country codes, S&P 500 company data, airport codes, and geographic boundaries, as well as enterprise data solutions. It features an AI-native interface with agentic workflows.
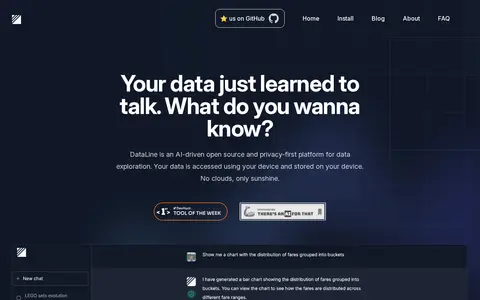
DataLine is an AI data analysis and visualization tool that lets users chat with their data to generate tables, charts, and dashboards. The page describes it as suited to non-technical people querying data and to developers seeking a text2sql solution.
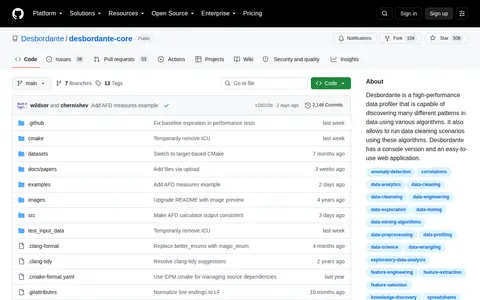
Desbordante is a high-performance open-source data profiler. It uses a variety of algorithms to discover different patterns in data and supports running data cleaning scenarios using these algorithms. The tool is available as a console version and an easy-to-use web application.
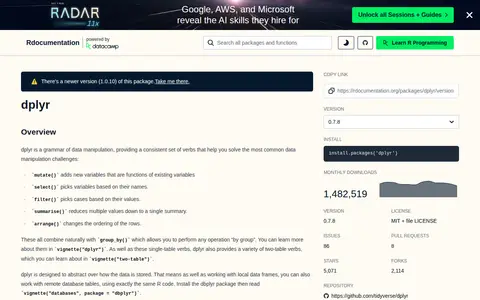
dplyr is an R package providing a grammar of data manipulation with a consistent set of verbs, including mutate(), select(), filter(), summarise() and arrange(), which combine with group_by(). It is designed to abstract over how data is stored, so the same R code works with local data frames and remote database tables via the dbplyr package.
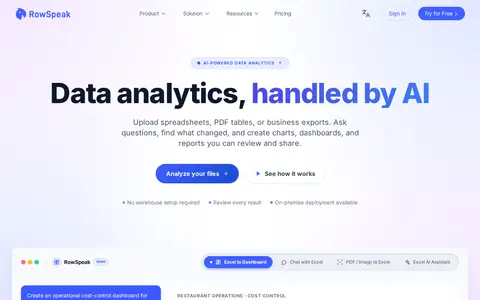
Excelmatic, offered by RowSpeak, is an AI-powered data analytics tool that processes messy Excel, CSV, PDF, and image tables. It uses AI to identify trends, explain data changes, generate charts, dashboards, and reports, cleanse data, and convert files between formats including images and PDFs to editable Excel spreadsheets.
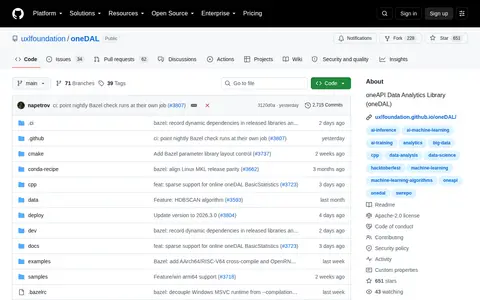
The oneAPI Data Analytics Library (oneDAL) is a library for data analytics. It is hosted on GitHub under the uxlfoundation/oneDAL repository. The repository provides usage examples, installation instructions, and documentation.
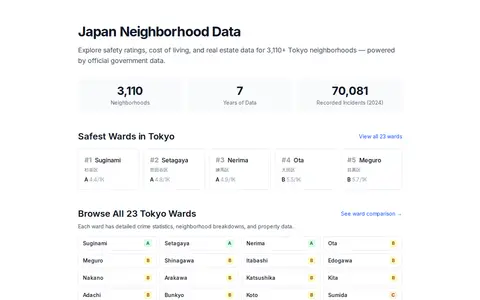
Japan Neighborhoods provides data-driven neighborhood guides for Japan. It offers crime statistics, safety scores, demographic data, cost of living, and real estate information for over 5,000 Tokyo neighborhoods. The data is sourced from official government sources and presented through safety rankings, interactive maps, and property listings.
Data Mining, Analytics, Big Data, Data, Science not a blog a portal.
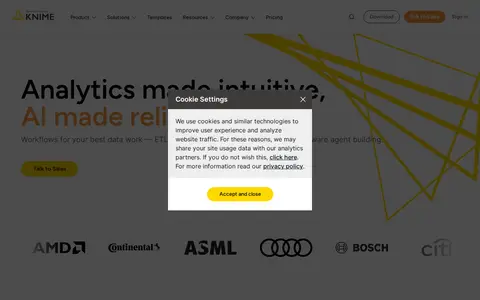
KNIME Analytics Platform is free and open source data analytics software with a visual workflow builder for creating data science solutions. The page lists access, blending and transformation of data from any source, visualization and analysis, and saving, sharing and reuse of workflows. It also describes integrating scripting in Python, R and JavaScript and deploying solutions in the enterprise.

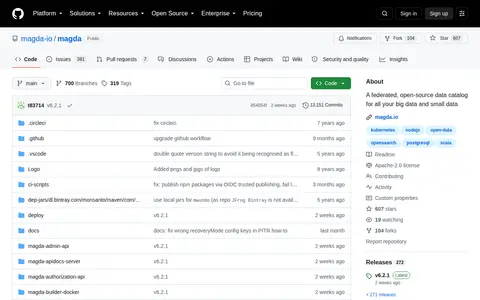
A federated, open-source data catalog for all your big data and small data.
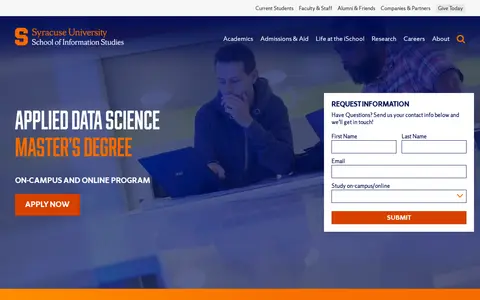
The Master of Applied Data Science is a graduate degree program offered by Syracuse University, available in both online and on-campus formats. The program can be completed in as little as one year and is designed to provide students with skills to thrive in data-driven environments.
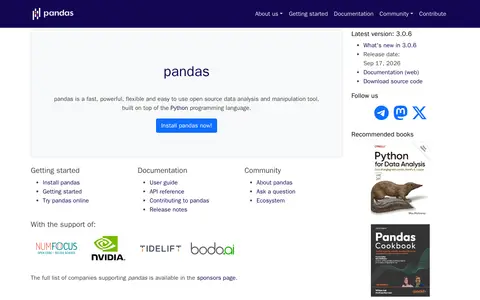
pandas is an open source, BSD-licensed library providing high-performance, easy-to-use data structures and data analysis tools for the Python programming language. It is described as a data analysis and manipulation tool built on top of Python. Documentation, a user guide and an API reference are available.
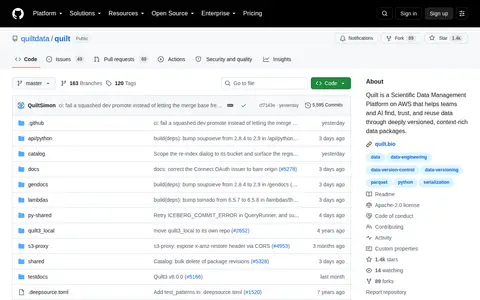
Quilt is a scientific data management platform hosted on Amazon Web Services (AWS) that helps teams and AI systems locate, verify the trustworthiness of, and reuse data via deeply versioned, context-rich data packages.
Redash is an open source tool for connecting to data sources, querying, visualizing and sharing data. It supports SQL, NoSQL, Big Data and API sources including PostgreSQL, MySQL, Redshift, BigQuery and MongoDB. Users build dashboards, set alerts and manage access.
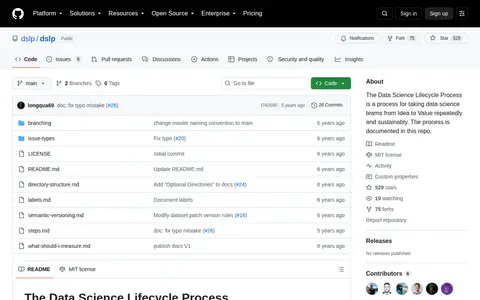
The Data Science Lifecycle Process is a repeatable, sustainable process for guiding data science teams from initial idea to delivered value. The process is fully documented in the public GitHub repository dslp/dslp.
Post by Travis Tang from DataDrivenInvestor.
A personal blog by Alex Smola titled Adventures in Data Land, covering machine learning topics. Entries include efficient LLM inference tutorials, random projections, effective sample size, voice agents and evaluation, and porting MXNet to Blackwell and Apple Silicon. Posts reference events such as the Machine Learning Summer School 2026 in NYC.
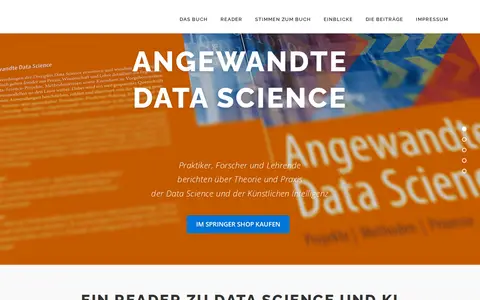
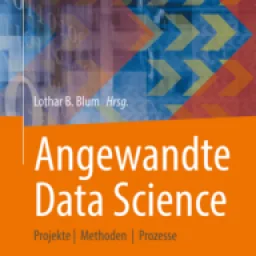
German book about applied data science.
Analyzes structured data and helps produce queries, insights or visualizations.
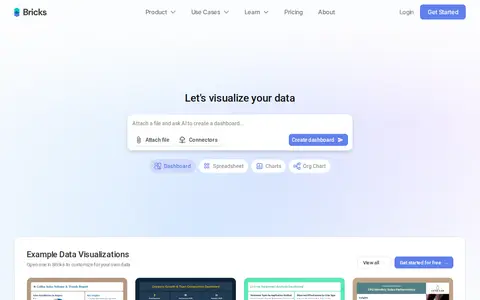
Bricks is an AI-powered workspace for organizing data, building dashboards, creating slides, and collaborating. It generates interactive dashboards from CSV and Excel data, and its documentation lists spreadsheets, live-updating dashboards, slides, and real-time collaboration.
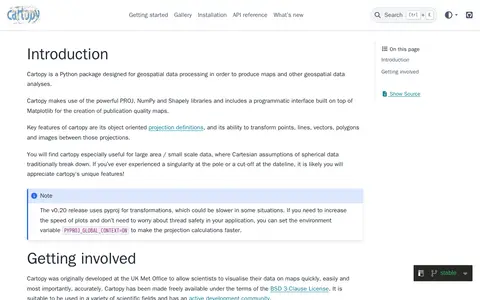
Cartopy is a Python package designed for geospatial data processing in order to produce maps and other geospatial data analyses.