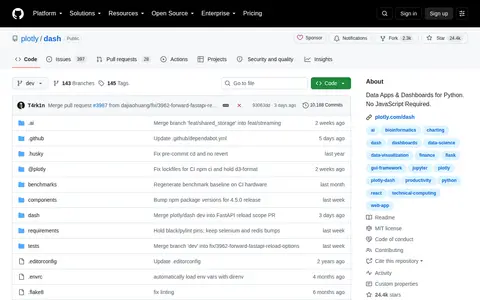

Dash is an open-source Python library for building data applications and dashboards without requiring JavaScript expertise. It is maintained by Plotly and hosted on the company's public GitHub repository, where users can access source code and contribute to the project.
Directory
Search results
Published directory entries matching your search.
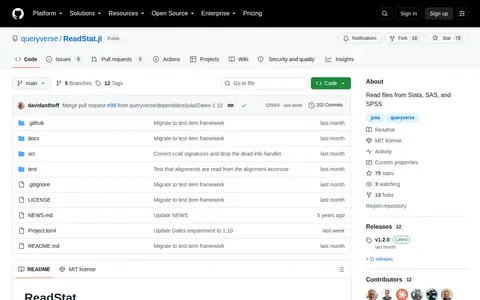
ReadStat.jl, listed as Data Read, is an open-source Julia library for reading data files in Stata, SAS, and SPSS formats. The project is hosted on GitHub under the queryverse organization, where users can access source code and contribute to its development.
Data Science Trello Board is a Trello project board intended for organizing data science work. The associated page displays a notice that Trello resources may fail to load due to browser, firewall or proxy configuration issues, and provides troubleshooting guidance for users.
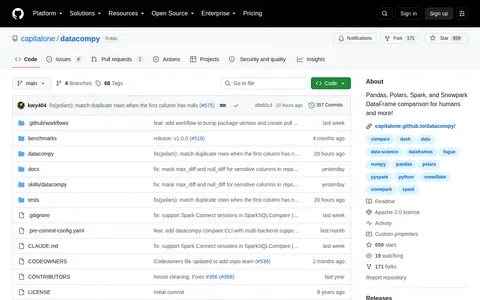
DataComPy is a package for comparing two DataFrames or tables. It supports Pandas, Polars, Spark (classic and Spark Connect), and Snowflake, and was originally created as a replacement for SAS PROC COMPARE for Pandas DataFrames. It prints stats and lets users adjust required match accuracy.
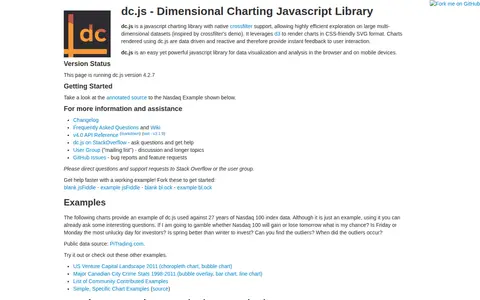
dc.js is a JavaScript charting library with native crossfilter support for exploring large multi-dimensional datasets. It uses d3 to render charts in CSS-friendly SVG format. Charts are data driven and reactive, providing instant feedback to user interaction. The library is described as usable in the browser and on mobile devices.
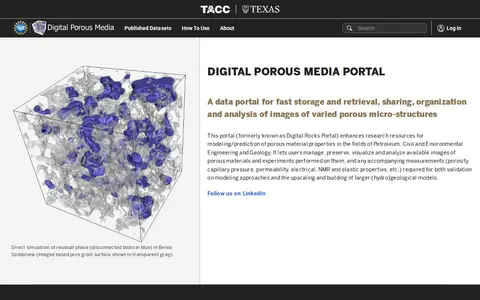
Digital Porous Media Portal, formerly Digital Rocks Portal, is a data portal for storage, retrieval, sharing, organization and analysis of images of porous micro-structures. It hosts public datasets and lets users manage, preserve, visualize and analyze images and related measurements such as porosity, capillary pressure and permeability for modeling porous material properties.
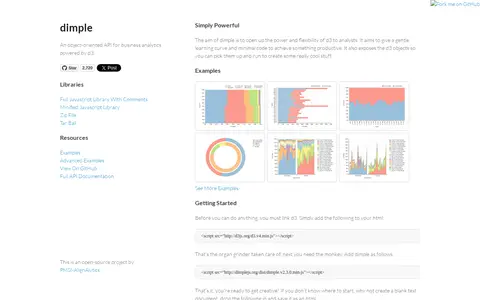
Dimple is an open-source charting API for d3 aimed at business analytics, letting users create and combine bar, line, area and scatter charts. It exposes underlying d3 objects so analysts can build on them, and requires linking d3 before adding dimple to a page.
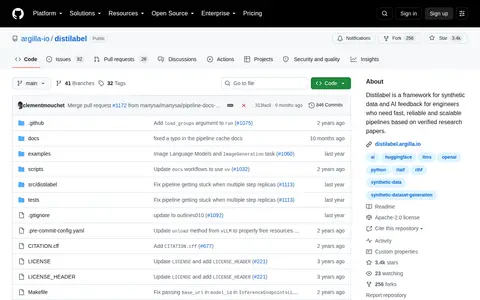
distilabel is a framework for synthetic data generation and AI feedback intended for engineers. It provides fast, reliable, and scalable pipelines based on verified research papers, supporting data synthesis for AI systems and on-the-fly feedback addition. The framework aims to improve AI output quality via enhanced data quality, give users control over their data and models, and boost efficiency through rapid iteration on research and large language models.
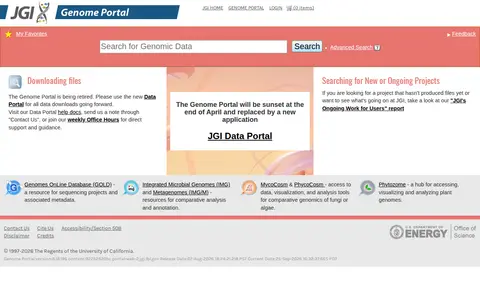
The JGI Genome Portal is a search and discovery interface for JGI projects, with filters for funding program, program year, taxonomy, project status and product type. It provides project identity, sequencing, analysis and contact information. The portal is being retired and will be sunset at the end of April, replaced by the JGI Data Portal, which users are directed to for downloads.
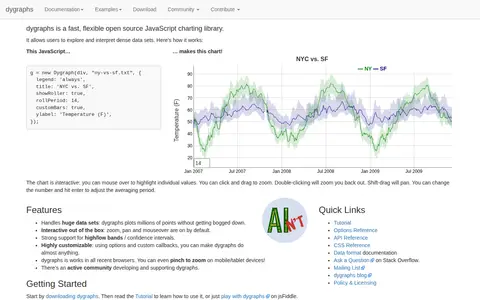
dygraphs is a fast, flexible open source JavaScript charting library that allows users to explore and interpret dense data sets. Charts are interactive, with zoom, pan and mouseover available by default, and the library handles very large data sets. It works in all recent browsers.
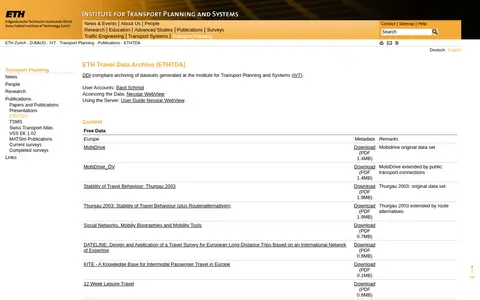
A virtual platform for travel data established in 2002 at ETH Zurich's Institute for Transport Planning and Systems. It lets end users browse archived travel data over the web and perform simple statistical analysis. The archive provides information on travel data developed or analysed at the institute, including details of the originating travel survey, and is built around the NESSTAR system.
Event Registry is a global news intelligence platform that collects and analyzes real-time news content from worldwide news publishers. It offers tools for media monitoring, event detection, trend discovery, sentiment analysis, and competitive intelligence, allowing users to search, summarize, visualize, and track news content and events of interest across 60+ languages.
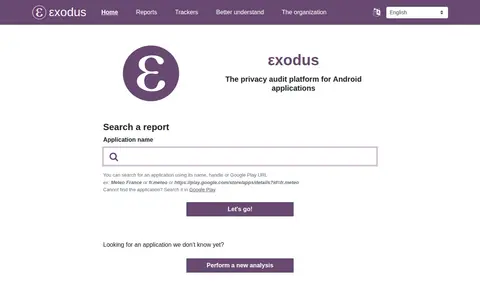
Exodus is a privacy audit platform for Android applications. It analyzes applications to list embedded trackers, which it describes as software intended to collect data about a user or their usages. Users can search for a report by application name, handle or Google Play URL, and reports show tracker and permission counts. The site states that it does not decompile applications and that its analysis method is legal.
Explainpaper is a tool for reading research papers. Users highlight confusing text to get explanations, and can ask follow-up questions. It offers plans from a free tier to paid Pro and Teams options, with Pro including advanced AI models and clickable explanations for graphs, figures and equations.
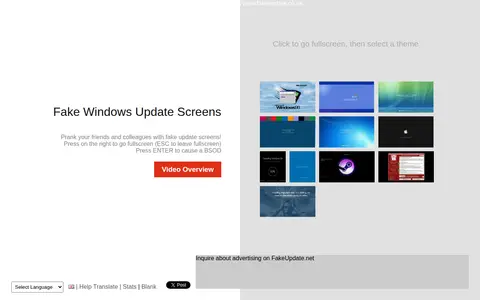
FakeUpdate.net is a prank website that displays fake Windows update screens for users to prank friends and colleagues. It offers fullscreen mode, a simulated blue screen of death, multiple visual themes, and support for numerous languages.
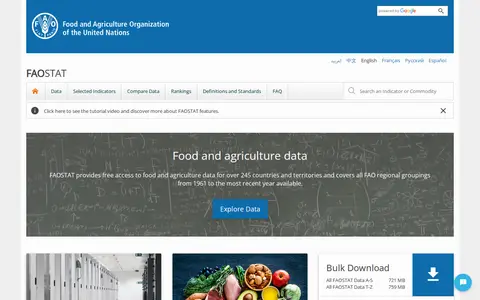
FAOSTAT is a database that provides free access to food and agriculture data for over 245 countries and territories. It covers all FAO regional groupings and includes data from 1961 up to the most recent year available. The service enables users to explore and analyze agricultural statistics globally.
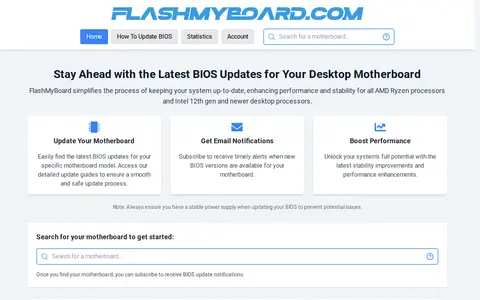
FlashMyBoard is a utility that simplifies motherboard BIOS updates. It hosts a searchable database of over 1900 Intel and AMD motherboards, provides release notes analysis, AGESA and microcode tracking, and email alerts for new BIOS versions. Users can download BIOS files directly from manufacturers with access to full version history, and the database is updated daily. It supports systems with AMD Ryzen processors and Intel 12th generation and newer desktop processors.
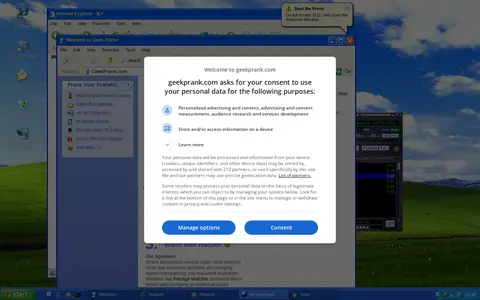
An online Windows XP simulator intended for pranking friends by secretly opening it on their computer in full screen. The site imitates the Windows XP operating system, letting users open programs, interact with the interface and trigger a blue error screen. It also offers Minesweeper and Tetris.
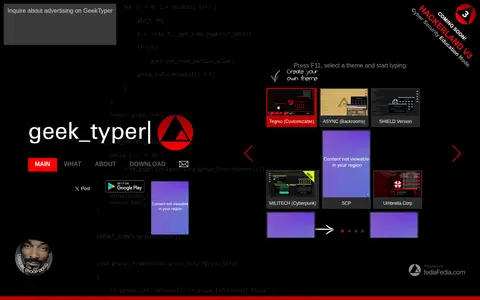
A hacking simulator that imitates the typing seen in movies and games. Users press F11, select a theme and start typing. Themes include Tegnio, SHIELD Version, Mr. Robot, Visual Studio, Fallout Version, Minecraft, Matrix, NASA and Plain Terminal.
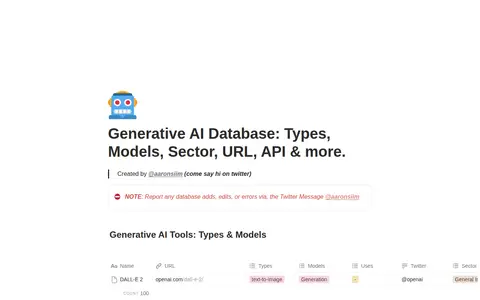
Generative AI Database is a Notion-based collaborative AI workspace built to align with an organization's existing context. It enables users to build and orchestrate AI agents directly alongside team projects, meetings, and connected applications.
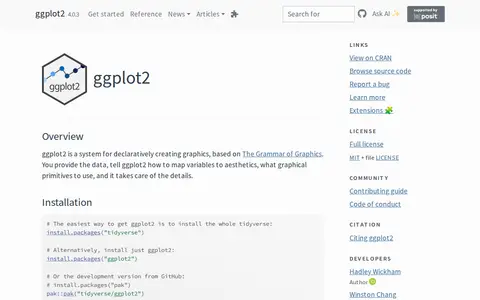
ggplot2 is a system for declaratively creating graphics, based on The Grammar of Graphics. Users provide the data and specify how variables map to aesthetics and which graphical primitives to use, and the system handles the details. It is described as over 10 years old, and installation is available through the tidyverse or as a standalone package.
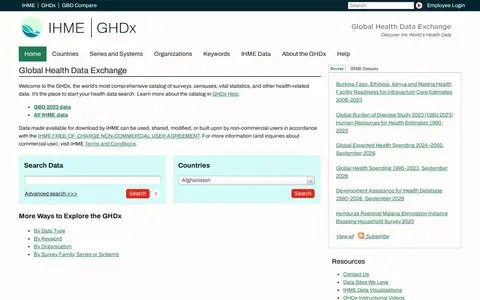
The Global Health Data Exchange (GHDx) is a catalog of global health and demographic data. It records information about data topics, links to data providers, and offers direct downloads where permission exists. The catalog covers surveys, censuses, vital statistics, registries, indicators, estimates, administrative health data, and health-related financial data. IHME-published data downloads may be used by non-commercial users under a free non-commercial user agreement.
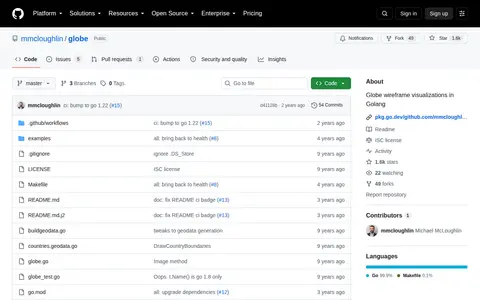
Globe is a Go library for wireframe globe visualizations, backed by pinhole. It can draw graticules, land and country boundaries, dots, lines along great circles, and rectangles, and save output as PNG. Users install it with go get, and the project is available under the ISC License.
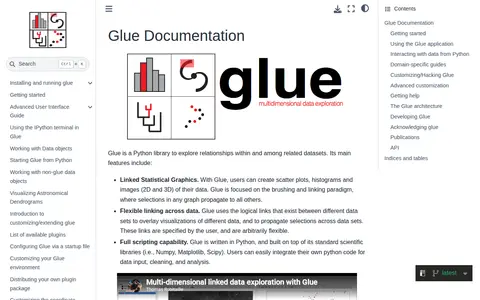
Glue is a Python library for exploring relationships within and among related datasets. It provides linked statistical graphics such as scatter plots, histograms and 2D and 3D images, with selections in one graph propagating to others. It supports user-specified links across datasets and scripting through Python's scientific libraries.