The Quiet-Broke Index is a research project modeled by Henry Finance that estimates the high-earner squeeze across 30 US metros at a $400,000 household income. It combines five fixed costs: housing, taxes, childcare, healthcare and transportation. A calculator gives a 0–100 score from five inputs, and the site ranks cities and reports per-line-item decomposition.
Directory
Search results
Published directory entries matching your search.
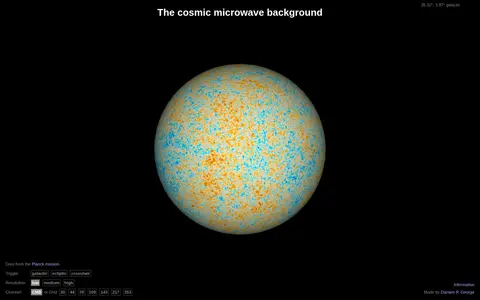
TheCMB is a WebGL visualization of raw data from the Planck mission showing intensity fluctuations in the cosmic microwave background. The data is tiled over a sphere using the Healpix scheme, with up to 50 million pixels at the highest resolution, and the view can be controlled with the mouse and keyboard.
Think Stats is an introduction to probability and statistics for Python programmers, emphasizing simple techniques for exploring real data sets and answering questions. It includes case studies using datasets from the National Institutes of Health and other sources, with exercises using short programs. The second edition is no longer current and is available under a Creative Commons license.
Humorous cyber threat map showing global attack-style visualizations for awareness and demos.
The Thunder Bay Open Data Portal is the City of Thunder Bay's public platform for accessing municipal datasets. It allows users to discover, analyze, and download data in formats including CSV, KML, Zip, GeoJSON, GeoTIFF and PNG. The portal provides API links for GeoServices, WMS and WFS, and supports the creation of StoryMaps and web maps for data visualization.
TimeSeries.jl is a lightweight framework for working with time series data in Julia. It is installed through the Julia package manager and provides a TimeArray type built from date or timestamp ranges and values.
Tonic is a tool for downloading, manipulating and loading event-based or spike-based data, described as similar to PyTorch Vision but for neuromorphic data. It provides event datasets and transformations, and the project states it is looking for a new maintainer.
Scripts to load several popular datasets including:.
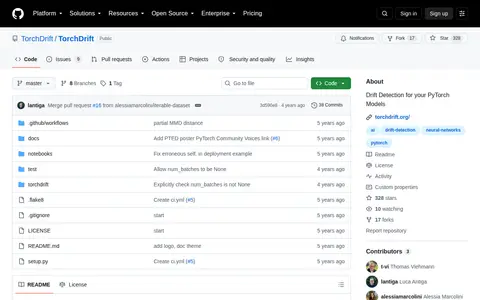
A data and concept drift library for PyTorch.
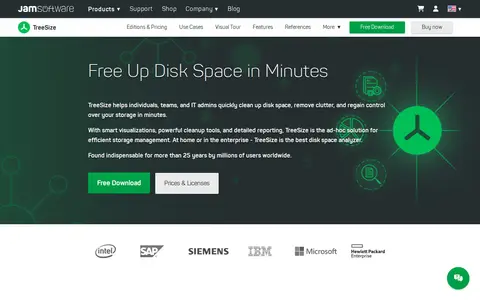
TreeSize is a disk space analyzer for Windows with customizable file search and exporting and reporting options. It provides visualizations including pie, bar and Treemap charts, detailed folder breakdowns and a Windows Explorer-like interface to identify large files and space consumption. It offers free and paid versions.
The JPL Tropical Cyclone Information System supports hurricane research and forecasting. It offers near-real-time portals that combine model forecasts with multi-parameter satellite and airborne observations, providing interactive visualization and online analysis tools. The system also hosts a 12-year global archive of multi-satellite hurricane observations.
Visualizes tweet topics, words, and patterns from a Twitter account or search result.
Interactive demo for exploring geotagged tweets and social activity on a map.
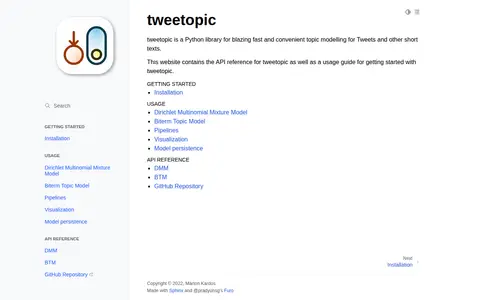
tweetopic is a Python library for topic modelling of Tweets and other short texts. Its documentation site provides an API reference and a usage guide covering installation, the Dirichlet Multinomial Mixture Model, the Biterm Topic Model, pipelines, visualization and model persistence.
Real-time visualization tool for architecture, product scenes, landscapes, and 3D presentations.
Typst is a document system developed in the open with a community, where the compiler is open source. Content is written as markup focused on structure, with formatting done automatically, and documents can be exported as a PDF, image, or website in preview. It supports visualizations, mathematics, plots, tables, code, bibliographies, and slides.
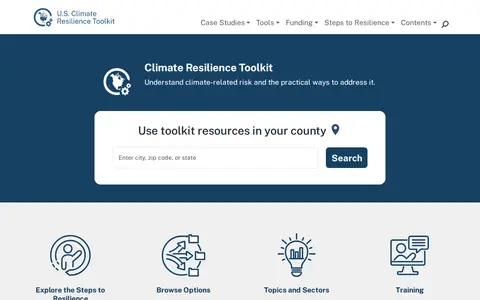
The U.S. Climate Resilience Toolkit is a website offering resources on understanding climate-related risk and practical ways to address it. It includes Steps to Resilience, topics and sectors, training, a registry of experts, and a help desk with FAQs and technical resources.
Ukraine Live Cams is a 3D map visualization of live cameras in Ukraine, Drag and arrow keys move, mouse wheel or plus/minus keys zoom, and holding the right mouse button or Ctrl while dragging rotates and tilts the view.
Real-time 3D engine for games, animation, virtual production, visualization, and interactive media.
Upgini is an open-source data search and enrichment library for Machine Learning and AI pipelines. It enables users to find and add relevant features from hundreds of public and premium external data sources, including open and commercial large language models.
Handbook and recipes for data-driven solutions of real-world problems.
Vaex is an open-source Python DataFrame library for working with large tabular datasets without loading them fully into memory. It supports lazy opening of CSV files and processing of hundreds of millions or billions of rows per second. The project also offers consultancy and training services.
Minimalist neural network library optimized for sparse data and single machine environments.
Online editor for building and previewing Vega and Vega-Lite data visualizations.