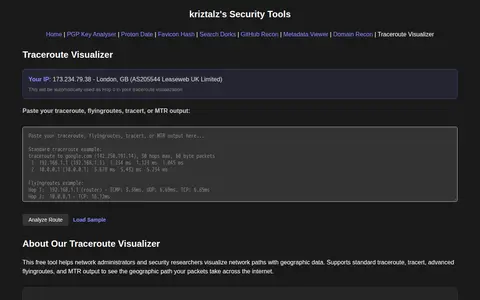

TracerouteVisualizer is a free browser tool that visualizes traceroute output with geographic maps. Users paste standard traceroute, tracert, flyingroutes, or MTR output, and the tool shows hop addresses, hostnames, locations, ISP and AS information, packet loss, response times and IXP detection. It is aimed at network administrators and security researchers for troubleshooting and security research.
Directory
Search results
Published directory entries matching your search.
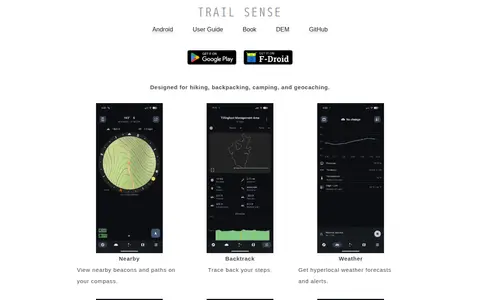
Trail Sense is an offline Android application designed for hiking, backpacking, camping, and geocaching. It offers tools including nearby beacon and path viewing, step backtracking, hyperlocal weather forecasts and alerts, sun and moon position tracking, photo-based offline maps, flashlight, clinometer, and packing lists. No user data is transmitted from the device, and the app does not require internet connectivity. It is distributed under the MIT License, and its developers state it is for informational purposes only and should not be relied on as a sole resource for survival activities.
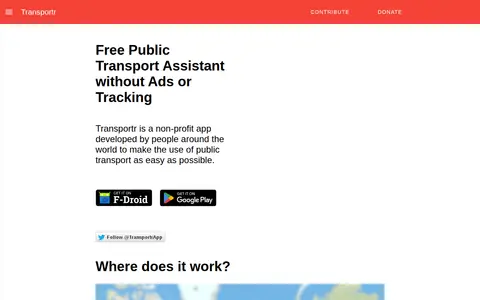
Transportr is a non-profit, open-source Android app for public transport that aims to make using transit easier. It displays stations and trips on maps, finds connections and transfers, shows live departures, including real-time delays in supported areas, and uses GPS for the current position. It saves frequently used locations and trips, and its source code is open.
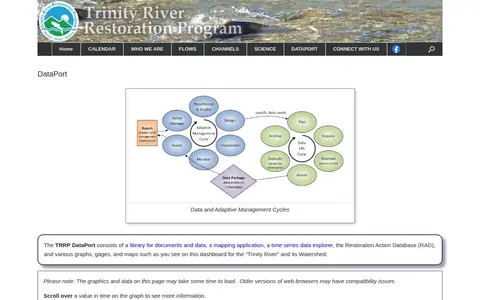
The TRRP DataPort is a library for documents and data, a mapping application, a time series data explorer, and the Restoration Action Database. It includes graphs, gages and maps for the Trinity River and its watershed.
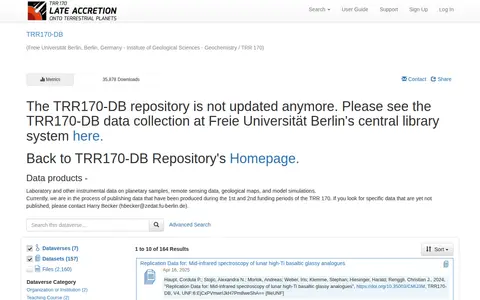
TRR170-DB is a repository whose page states it is no longer updated and directs readers to the TRR170-DB data collection at Freie Universität Berlin's central library system. It lists data products including laboratory and instrumental data on planetary samples, remote sensing data, geological maps and model simulations.
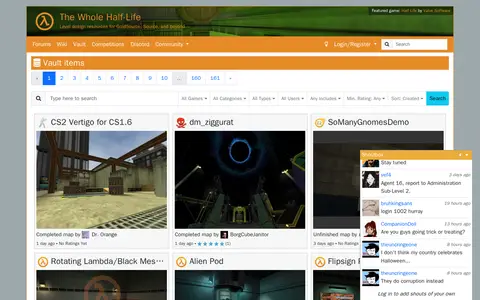
TWHL Vault is a page on TWHL, a site offering level design resources for GoldSource, Source, and beyond. The vault lists user-submitted items such as completed maps and mods, along with their dates and ratings.
ArcGIS map showing UK onshore oil and gas activity, sites, and related geographic layers.
Liveuamap is an independent global news and information site that reports on topics such as conflicts, human rights issues, protests, terrorism, weapons deployment, health matters, natural disasters and weather. It presents news through a map-centric approach and provides open online access to a chronological archive. It was founded in 2014 to inform about the Ukrainian conflict and later expanded to other regions.
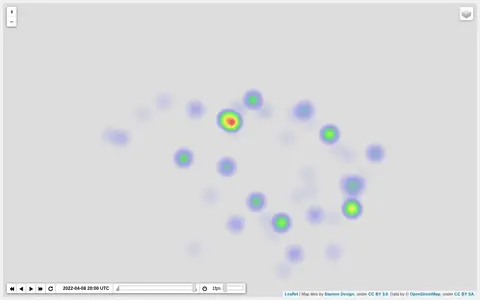
Heatmap visualizing Ukraine war activity, incidents, and conflict intensity by location.
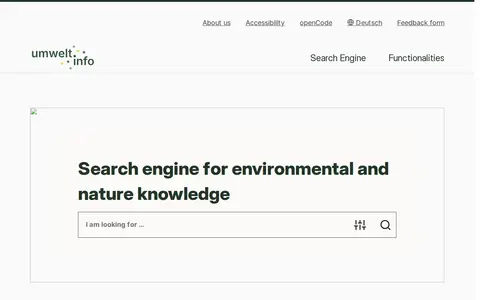
umwelt.info is a search engine for environmental and nature knowledge. It supports text queries and search filters, and lists topics such as flood risk areas, rainwater and mixed sewerage, and hazard maps. A sample search result is the Hamburg Wasserbuch, which records water use rights.
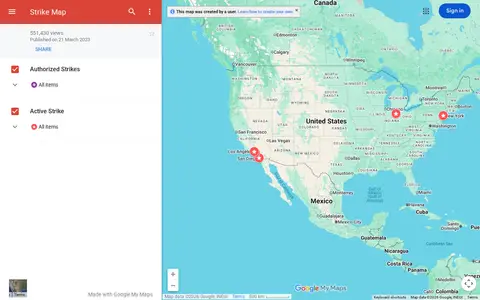
Google map tracking labor strikes, workplace actions, and related events across the United States.
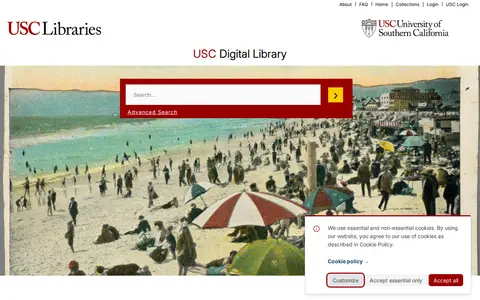
The USC Digital Library is the digital library of the University of Southern California. It provides access to rare and archival materials including photographs, maps, manuscripts, and recordings from USC and partner institutions, and hosts collections across a range of academic subject areas.
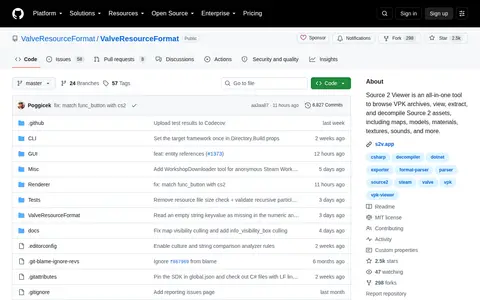
Source 2 Viewer is an all-in-one tool to browse VPK archives, view, extract, and decompile Source 2 assets, including maps, models, materials, textures, sounds, and more.
Växjö Municipality Open Geographical Data is an ArcGIS Hub platform for geographic data. Users can discover, analyze and download data in formats including CSV, KML, Zip, GeoJSON, GeoTIFF and PNG, access API links for GeoServices, WMS and WFS, and create StoryMaps and Web Maps.
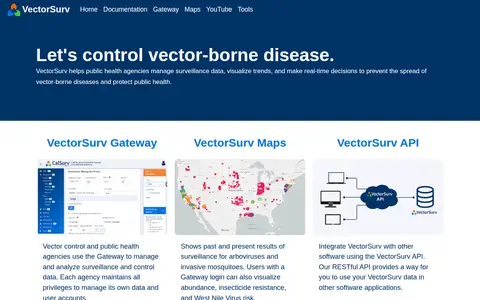
VectorSurv is a vector-borne disease surveillance system. Public health and vector control agencies use the Gateway to manage and analyze surveillance and control data, and each agency keeps privileges to manage its own data and user accounts. VectorSurv Maps shows past and present surveillance results for arboviruses and invasive mosquitoes. A RESTful API lets users integrate VectorSurv data with other software.
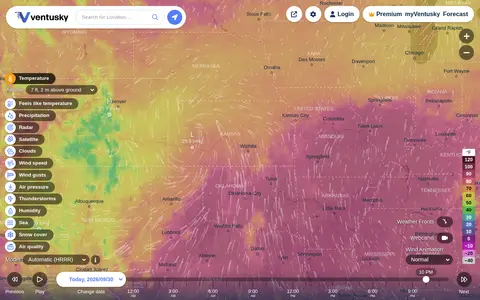
Ventusky provides live weather maps showing wind, rain, radar and temperature, with over 50 weather layers and detailed forecasts. Data comes from weather forecast models including ECMWF, GFS, ICON and GEM.
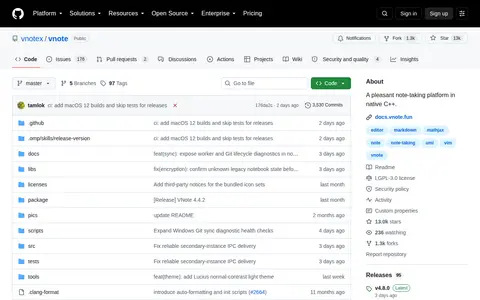
VNote is a free and open source note-taking application built with Qt. It combines note management with editing across several document formats, including Markdown, plain text, source code, mind maps and PDF. It runs on Linux, Windows and macOS and requires Qt 6.
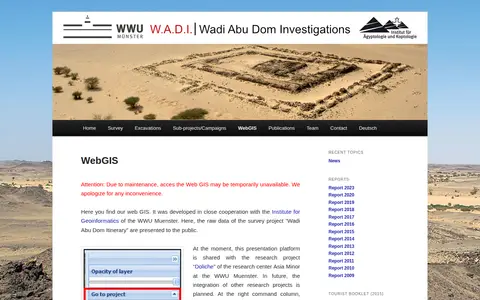
Web GIS presenting raw survey data from the Wadi Abu Dom Itinerary project, developed with the Institute for Geoinformatics of the WWU Muenster. The platform is currently shared with the Doliche research project. It offers a layer tree for loading datasets and background maps such as Open Street Map or Google Earth, and allows uploading gpx or kml data for private comparison.
ArcGIS dashboard showing Walmart store status, closures, and location-based operational updates.
Wand is a free app offering interactive maps, game guidance, and customization tools for thousands of PC games. It provides gameplay assists that can be toggled on or off, in-game guidance and an overlay accessible by pressing Alt+W, one-click launch for 3500+ games, and a paid Wand Pro tier with advanced features.
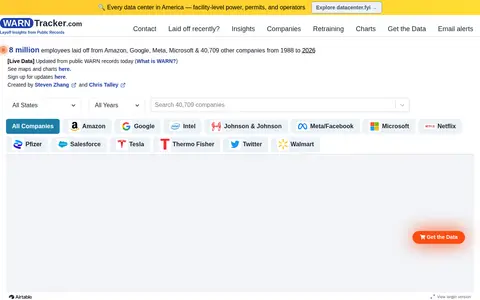
WARNTracker tracks layoffs reported in public WARN records, drawing on filings that employers submit to states before large layoffs. It presents layoff maps and charts by state and year, plus company and role breakdowns, and covers 8.1 million employees laid off from 41,052 companies from 1988 to 2026. The site notes its data is not exhaustive.
Waze Live Map shows traffic, road alerts, routes, and driver-reported incidents in real time.
Week in OSINT is a weekly collection of OSINT news published on Sector035's site, typically appearing every Monday at 8:00 AM CEST. Each installment lists articles, tools, podcasts and other resources on topics such as privacy, maps, bookmarks, domains and geolocation.
The Western Regional Climate Center provides climate services for the western United States, with interactive web apps, climate maps, drought trackers, station metadata, and monitoring station data feeds. Station coverage spans the western Pacific, Alaska, Hawaii, U.S. islands, the Pacific coast and inland to the Rocky Mountains. A legacy site was established at wrcc-archive.dri.edu.