notesjor.de
ML, DL and Data Science - with a focus on text-/data-mining.
Directory
Published directory entries matching your search.
ML, DL and Data Science - with a focus on text-/data-mining.

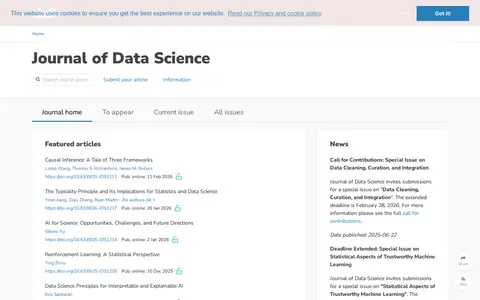
The Journal of Data Science is an academic journal listing featured articles, news, and calls for contributions. Featured articles include items on causal inference, reinforcement learning, and AI for science, each with a DOI and online publication date. The page also lists special issue calls for contributions and most-read articles.

JSON Schema is a declarative language for annotating and validating JSON documents' structure, constraints, and data types. It enables JSON data consistency, validity, and interoperability, and has a tooling ecosystem of validators, generators, and linters. Documentation covers schema design, guides, and keyword reference.

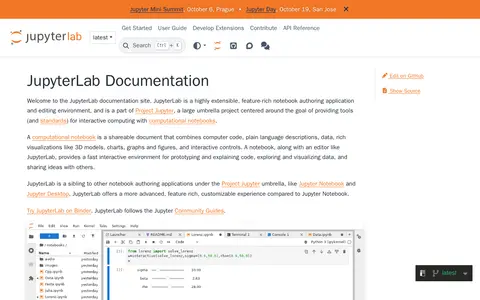
JupyterLab is an extensible notebook authoring application and editing environment within Project Jupyter. A notebook combines code, text descriptions, data and visualizations. JupyterLab provides an environment for prototyping and explaining code, exploring and visualizing data, and sharing ideas. It is a sibling to Jupyter Notebook and Jupyter Desktop and is described as offering a more advanced, customizable experience than Jupyter Notebook.

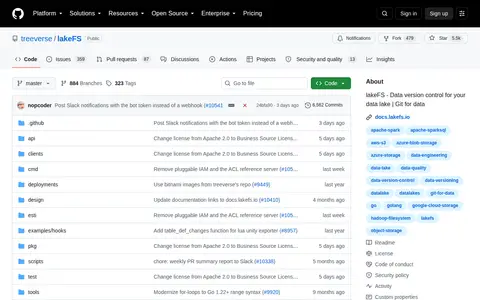
lakeFS is a source-available data version control tool that turns object storage into a Git-like repository, allowing data lakes to be managed like code. It supports AWS S3, Azure Blob Storage and Google Cloud Storage, is API compatible with S3, and works with frameworks such as Spark, Hive, AWS Athena, DuckDB and Presto.
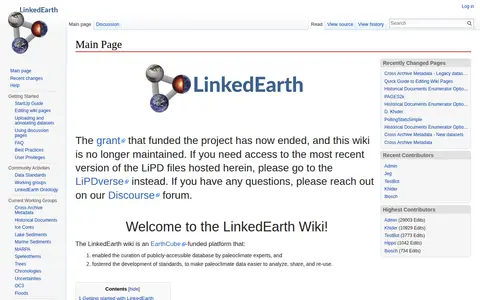
The LinkedEarth Wiki is an EarthCube-funded platform that supported the curation of a publicly accessible paleoclimate database by domain experts and the development of standards to improve paleoclimate data analysis, sharing and reuse. The project grant has ended, the wiki is no longer maintained, and the most recent LiPD files are hosted on the LiPDverse platform.
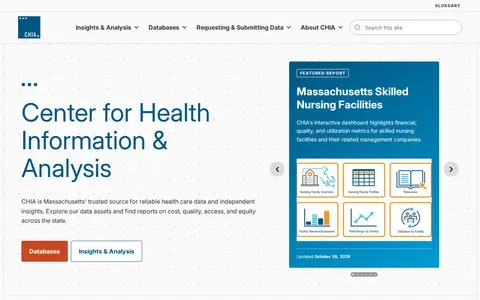
Open data portal of Massachusetts state government.
Analyzes structured data and helps produce queries, insights or visualizations.

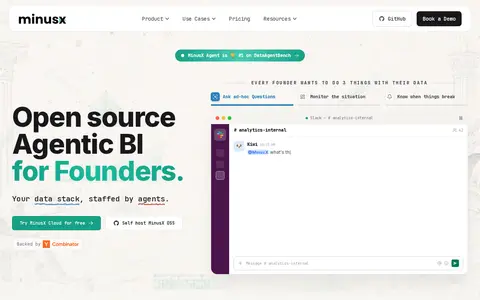
MinusX is an open source agentic business intelligence platform that combines a data agent with a BI tool. It answers questions, builds dashboards and sets alerts, with slides and data stories, visualizations and a SQL GUI. It can be self-hosted or used via MinusX Cloud, and the source is available and inspectable.

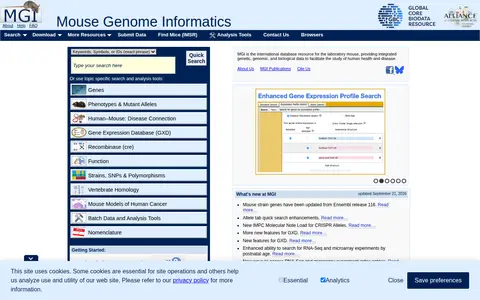
Mouse Genome Informatics is an international database resource for the laboratory mouse. It provides integrated genetic, genomic, and biological data to facilitate the study of human health and disease. The site offers search and analysis tools covering genes, phenotypes, alleles, human disease, gene expression, recombinase function, strains, SNPs, homology, and references.

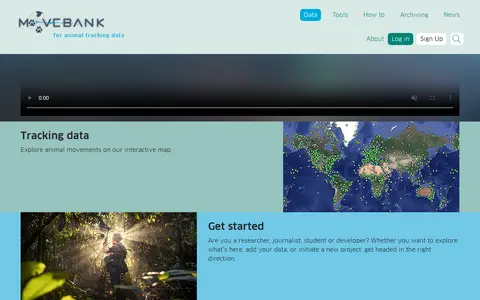
Movebank is a free online database of animal tracking data hosted by the Max Planck Institute of Animal Behavior. It helps animal tracking researchers manage, share, protect, analyze and archive their data, and offers an interactive map for exploring animal movements.
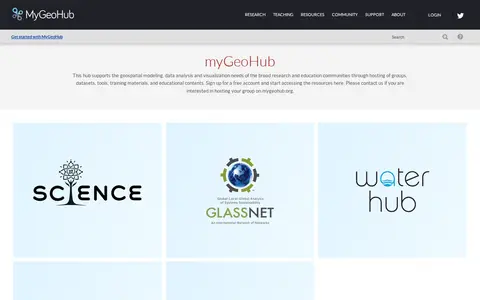
MyGeoHub is a hub built on the HUBzero platform that supports geospatial modeling, data analysis and visualization for research and education communities. It hosts groups, datasets, tools, training materials and educational content, and offers a free account for accessing resources. It also allows groups to be hosted on the site.
Analyzes structured data and helps produce queries, insights or visualizations.
nbshare.io is a platform for learning data analytics using Python and R. It hosts a collection of notebooks covering topics including artificial intelligence, machine learning, basic Python coding, data analytics, web scraping and other related technical subjects.

How a Social Scientist Jumps into the World of Big Data.
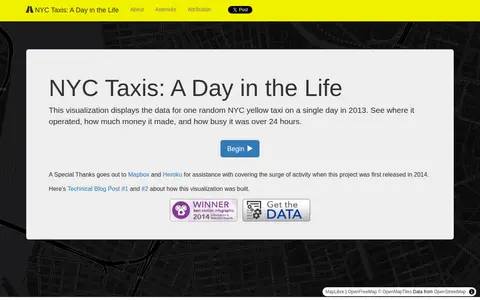
A data visualization by Chris Whong showing the activities of one random NYC yellow taxi on a single day in 2013, including where it operated and how much money it made. It uses taxi trip data provided by the Taxi and Limousine Commission via a FOIL request. Trip routes were produced with Google's Directions API and are not assumed accurate.

Onyx is a distributed, masterless data processing system written in pure Clojure, with a batch and stream hybrid processing model. The repository is archived and read-only. Listed uses include realtime event stream processing, extract, transform, load, and data cleaning.

OpenMetadata is an open-source AI context layer powered by metadata, semantics, and memory that provides a shared, rich understanding of data for people and AI. It was built by the founders of Apache Hadoop, Apache Atlas, and Uber Databook. The unified platform supports data cataloging, discovery, quality, observability, governance, lineage, and collaboration.

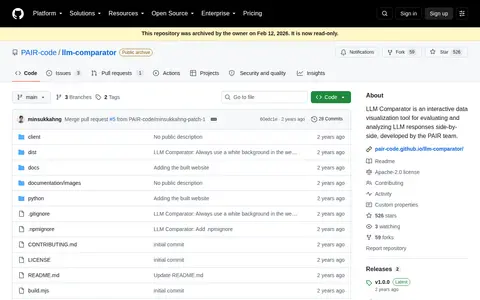
LLM Comparator is an interactive data visualization tool for evaluating and analyzing large language model responses side-by-side, developed by the PAIR team. It includes a Python library for creating JSON files and a defined JSON data format.

, a pluggable architecture for data and image processing, which can.

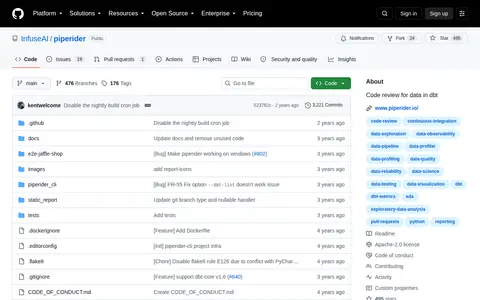
PipeRider is a tool described as code review for data in dbt. It compares data to highlight differences in impacted downstream dbt models, profiles dbt models, and generates a static HTML report each run. The project states that PipeRider has been superseded by Recce and will no longer be updated on a regular basis.

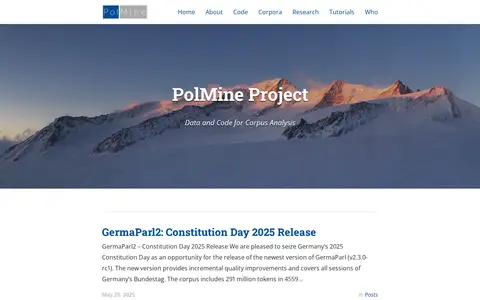
PolMine is a project providing data and code for corpus analysis. It publishes releases of the GermaParl corpus of plenary protocols of the German Bundestag, including a version covering all sessions from 1949 to 2021 in annotated form. Post updates describe incremental quality improvements to the corpus and look ahead to further work.

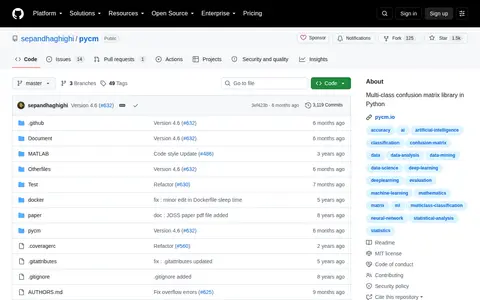
PyCM is a multi-class confusion matrix library written in Python. It supports input data vectors and direct matrices and offers post-classification model evaluation statistics. It is aimed at data scientists needing metrics for predictive models and classifiers. A MATLAB setup is also documented.

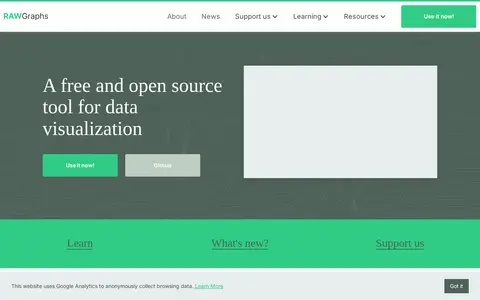
RAWGraphs is a free and open source tool for data visualization. It is a web app that offers almost 30 visual models to visualize quantities, hierarchies and time series. Data inserted is processed only by the web browser, and projects can be saved or exported as vector or raster images.